2510 Payne Cir E Colorado Springs, CO 80916
Southborough NeighborhoodEstimated Value: $333,960 - $365,000
5
Beds
2
Baths
983
Sq Ft
$353/Sq Ft
Est. Value
About This Home
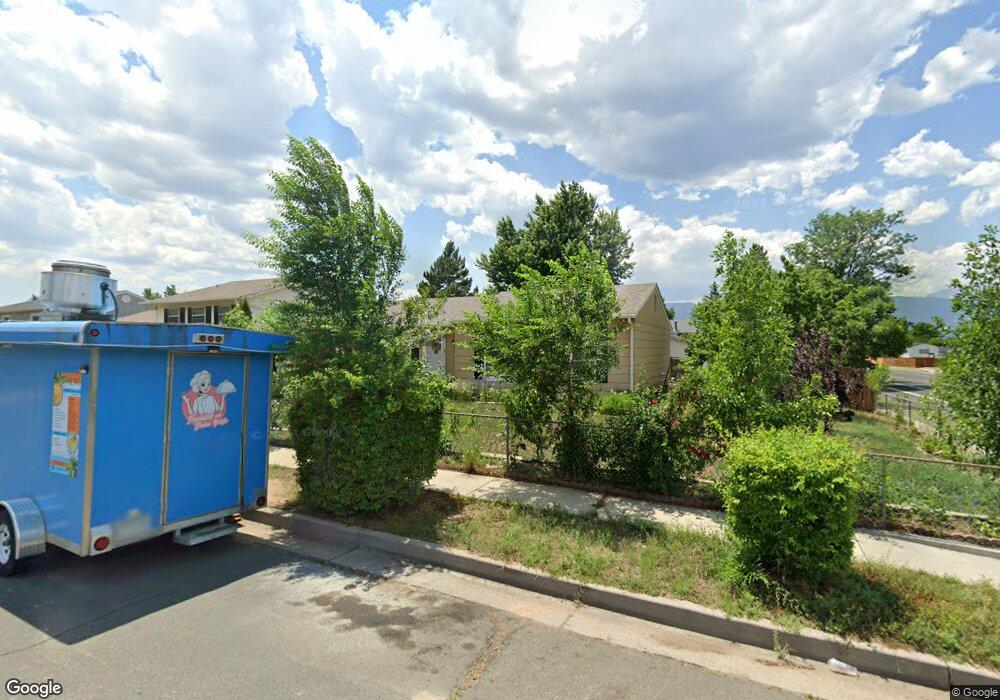
This home is located at 2510 Payne Cir E, Colorado Springs, CO 80916 and is currently estimated at $347,240, approximately $353 per square foot. 2510 Payne Cir E is a home located in El Paso County with nearby schools including Giberson Elementary School, Panorama Middle School, and Sierra High School.
Ownership History
Date
Name
Owned For
Owner Type
Purchase Details
Closed on
Nov 16, 2016
Sold by
Westman Rosa G
Bought by
Yanez Jose A
Current Estimated Value
Home Financials for this Owner
Home Financials are based on the most recent Mortgage that was taken out on this home.
Original Mortgage
$173,483
Outstanding Balance
$139,057
Interest Rate
3.37%
Mortgage Type
FHA
Estimated Equity
$208,183
Purchase Details
Closed on
Oct 30, 1997
Sold by
Westman Travis A and Westman Angela G
Bought by
Westman Rosa G
Home Financials for this Owner
Home Financials are based on the most recent Mortgage that was taken out on this home.
Original Mortgage
$68,250
Interest Rate
7.28%
Purchase Details
Closed on
Sep 15, 1994
Sold by
Westman Rosa G
Bought by
Westman Rosa G and Gaster Angela G
Purchase Details
Closed on
Jul 6, 1994
Sold by
Westman Oliver A
Bought by
Westman Rosa G
Purchase Details
Closed on
Nov 1, 1977
Bought by
Yanez Jose A
Create a Home Valuation Report for This Property
The Home Valuation Report is an in-depth analysis detailing your home's value as well as a comparison with similar homes in the area
Home Values in the Area
Average Home Value in this Area
Purchase History
| Date | Buyer | Sale Price | Title Company |
|---|---|---|---|
| Yanez Jose A | $190,500 | First American Heritage Titl | |
| Westman Rosa G | -- | Stewart Title | |
| Westman Rosa G | -- | -- | |
| Westman Rosa G | -- | -- | |
| Yanez Jose A | -- | -- |
Source: Public Records
Mortgage History
| Date | Status | Borrower | Loan Amount |
|---|---|---|---|
| Open | Yanez Jose A | $173,483 | |
| Previous Owner | Westman Rosa G | $68,250 |
Source: Public Records
Tax History Compared to Growth
Tax History
| Year | Tax Paid | Tax Assessment Tax Assessment Total Assessment is a certain percentage of the fair market value that is determined by local assessors to be the total taxable value of land and additions on the property. | Land | Improvement |
|---|---|---|---|---|
| 2025 | $1,244 | $25,110 | -- | -- |
| 2024 | $970 | $25,190 | $3,580 | $21,610 |
| 2023 | $970 | $25,190 | $3,580 | $21,610 |
| 2022 | $980 | $18,170 | $3,130 | $15,040 |
| 2021 | $1,046 | $18,690 | $3,220 | $15,470 |
| 2020 | $1,018 | $15,620 | $2,500 | $13,120 |
| 2019 | $987 | $15,620 | $2,500 | $13,120 |
| 2018 | $726 | $11,060 | $1,800 | $9,260 |
| 2017 | $554 | $11,060 | $1,800 | $9,260 |
| 2016 | $590 | $11,050 | $1,830 | $9,220 |
| 2015 | $590 | $11,050 | $1,830 | $9,220 |
| 2014 | $543 | $10,060 | $1,830 | $8,230 |
Source: Public Records
Map
Nearby Homes
- 2438 Barkman Dr
- 2335 Cather Cir
- 4150 Shining Way
- 2430 Cather Ct
- 4243 Gatewood Dr
- 4485 Carolyn Dr
- 2575 Nadine Dr
- 4139 Morley Cir
- 4527 Lamplighter Cir Unit 3
- 2758 Ferber Dr
- 2521 Astrozon Cir
- 4475 London Ln
- 4565 Barkman Cir
- 4537 Lamplighter Cir Unit 4
- 2456 Sierra Springs Dr
- 4560 Barkman Cir
- 3920 Morley Dr
- 4450 Wordsworth Cir N
- 2438 Lexington Village Ln Unit M6
- 4323 Hunting Meadows Cir Unit 5
- 2520 Payne Cir E
- 4225 Astrozon Blvd
- 2530 Payne Cir E
- 2505 Payne Cir E
- 2476 Payne Cir E
- 4295 Morley Dr
- 4285 Morley Dr
- 2515 Payne Cir E
- 2540 Payne Cir E
- 4222 Astrozon Blvd
- 4265 Morley Dr
- 2525 Payne Cir E
- 2481 Payne Cir E
- 2468 Payne Cir E
- 2550 Payne Cir E
- 2535 Payne Cir E
- 4218 Astrozon Blvd
- 2510 Anjelina Cir W
- 2471 Payne Cir E
- 2516 W Anjelina Cir