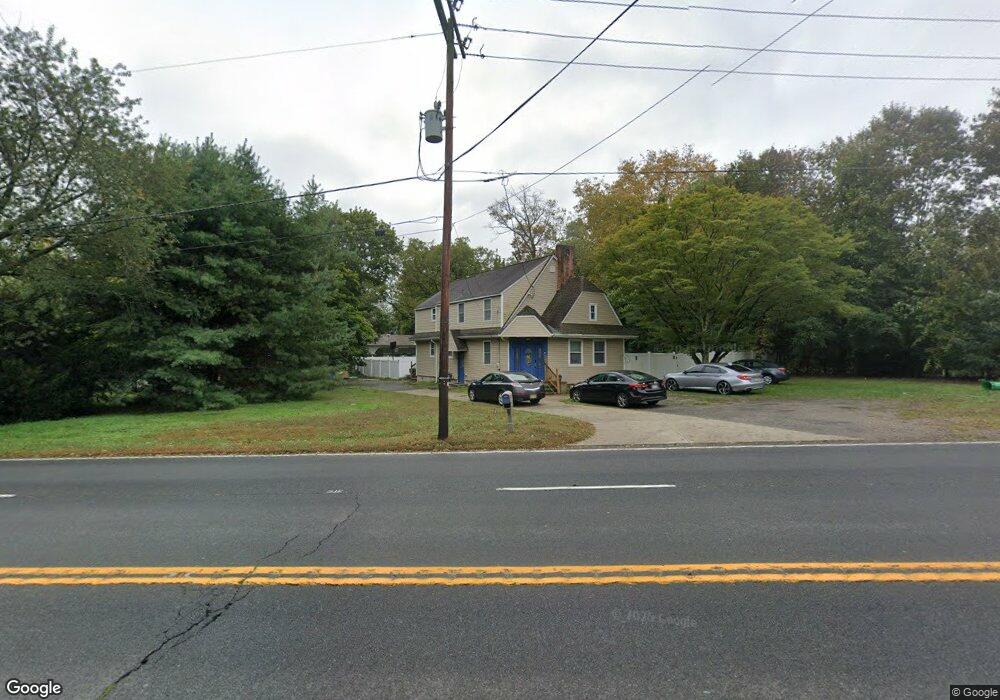
2510 State Route 33 Neptune, NJ 07753
Estimated Value: $560,000 - $636,015
4
Beds
3
Baths
2,226
Sq Ft
$266/Sq Ft
Est. Value
About This Home
This home is located at 2510 State Route 33, Neptune, NJ 07753 and is currently estimated at $592,004, approximately $265 per square foot. 2510 State Route 33 is a home located in Monmouth County with nearby schools including Neptune High School.
Ownership History
Date
Name
Owned For
Owner Type
Purchase Details
Closed on
May 3, 2024
Sold by
Hughes Leon and Hughes Madella
Bought by
Mckay Corey
Current Estimated Value
Home Financials for this Owner
Home Financials are based on the most recent Mortgage that was taken out on this home.
Original Mortgage
$516,500
Outstanding Balance
$509,175
Interest Rate
6.82%
Mortgage Type
VA
Estimated Equity
$82,829
Purchase Details
Closed on
Jun 28, 2017
Sold by
Lawson James
Bought by
Hughes Leon and Hughes Madella
Home Financials for this Owner
Home Financials are based on the most recent Mortgage that was taken out on this home.
Original Mortgage
$319,113
Interest Rate
4.87%
Mortgage Type
FHA
Purchase Details
Closed on
Aug 30, 2016
Sold by
Monmouth County Sheriff
Bought by
Lawson James
Create a Home Valuation Report for This Property
The Home Valuation Report is an in-depth analysis detailing your home's value as well as a comparison with similar homes in the area
Home Values in the Area
Average Home Value in this Area
Purchase History
| Date | Buyer | Sale Price | Title Company |
|---|---|---|---|
| Mckay Corey | $500,000 | Realsafe Title | |
| Mckay Corey | $500,000 | Realsafe Title | |
| Hughes Leon | $325,000 | None Available | |
| Lawson James | $81,000 | None Available |
Source: Public Records
Mortgage History
| Date | Status | Borrower | Loan Amount |
|---|---|---|---|
| Open | Mckay Corey | $516,500 | |
| Closed | Mckay Corey | $516,500 | |
| Previous Owner | Hughes Leon | $319,113 |
Source: Public Records
Tax History Compared to Growth
Tax History
| Year | Tax Paid | Tax Assessment Tax Assessment Total Assessment is a certain percentage of the fair market value that is determined by local assessors to be the total taxable value of land and additions on the property. | Land | Improvement |
|---|---|---|---|---|
| 2025 | $9,534 | $526,400 | $277,600 | $248,800 |
| 2024 | $8,409 | $544,500 | $264,200 | $280,300 |
| 2023 | $8,409 | $465,600 | $191,900 | $273,700 |
| 2022 | $7,505 | $448,400 | $187,800 | $260,600 |
| 2021 | $7,505 | $355,200 | $158,600 | $196,600 |
| 2020 | $7,064 | $333,500 | $147,200 | $186,300 |
| 2019 | $7,580 | $353,400 | $141,500 | $211,900 |
| 2018 | $7,482 | $344,800 | $134,500 | $210,300 |
| 2017 | $3,341 | $147,900 | $129,400 | $18,500 |
| 2016 | $6,260 | $276,400 | $120,400 | $156,000 |
| 2015 | $5,826 | $261,600 | $109,400 | $152,200 |
| 2014 | $6,409 | $236,600 | $100,400 | $136,200 |
Source: Public Records
Map
Nearby Homes
- 1000 Corlies Ave
- 701 Fletcher Dr
- 1 Oak Dr
- 116 Moss Place
- 309 Deal Ave
- 2 Squirrel Rd
- 22 Phoebe Dr
- 208 Ivins Rd
- 8 Knox Blvd
- 634 Wayside Rd
- 636 Wayside Rd
- 9 Hillview Dr
- 302 Helen Terrace
- 1208 Alpine Trail
- 220 W Sylvania Ave Unit 25
- 341 Victor Place
- 3 Manor Dr
- 35 Shorebrook Cir
- 2 Carol Ave
- 419 Prospect Ave
- 400 Prospect Place
- 2500 State Route 33
- 2503 State Route 33
- 309 Old Corlies Ave
- 307 Old Corlies Ave
- 2501 State Route 33
- 311 Old Corlies Ave
- 2505 State Route 33
- 404 Prospect Place
- 301 Old Corlies Ave
- 2507 State Route 33
- 2601 Corlies Ave
- 411 Prospect Place
- 2601 State Route 33
- 2601 Highway 33
- 213 Wayside Rd
- 210 Wayside Rd
- 230 Poplar Place
- 412 Prospect Place
- 325 Old Corlies Ave