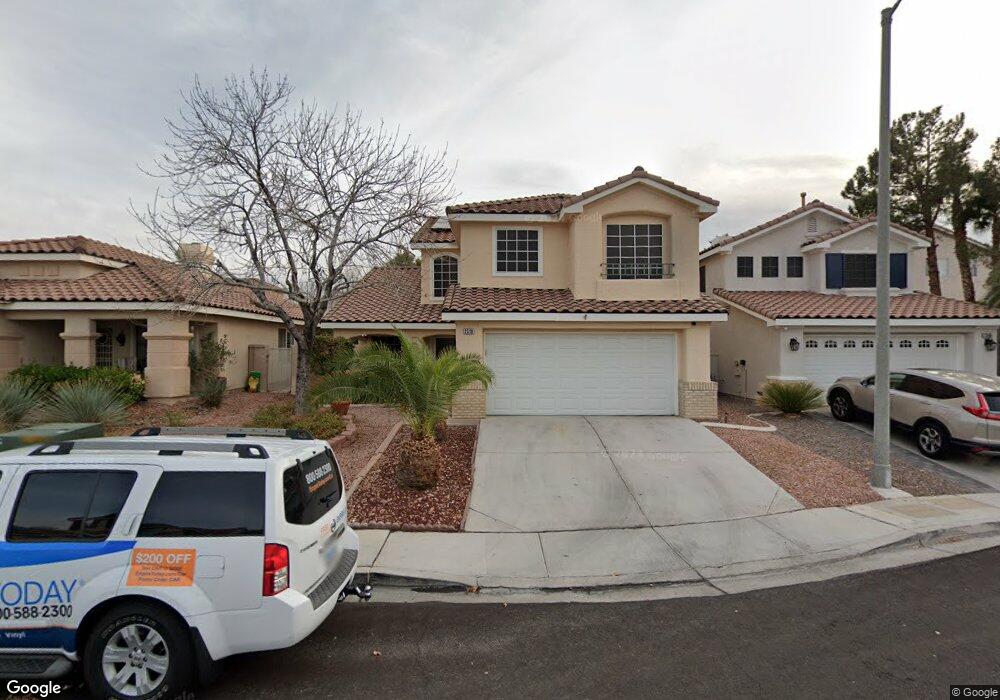
2510 Via di Autostrada Henderson, NV 89074
Green Valley South NeighborhoodEstimated Value: $453,980 - $484,000
4
Beds
3
Baths
1,724
Sq Ft
$271/Sq Ft
Est. Value
About This Home
This home is located at 2510 Via di Autostrada, Henderson, NV 89074 and is currently estimated at $467,495, approximately $271 per square foot. 2510 Via di Autostrada is a home located in Clark County with nearby schools including John Vanderburg Elementary School, Neil C. Twitchell Elementary School, and Bob Miller Middle School.
Ownership History
Date
Name
Owned For
Owner Type
Purchase Details
Closed on
Oct 5, 2020
Sold by
Al Haq Fazila Irfan
Bought by
Al Haq Irfan
Current Estimated Value
Home Financials for this Owner
Home Financials are based on the most recent Mortgage that was taken out on this home.
Original Mortgage
$308,750
Outstanding Balance
$274,617
Interest Rate
2.9%
Mortgage Type
New Conventional
Estimated Equity
$192,878
Purchase Details
Closed on
Sep 29, 2020
Sold by
Roberts Lauire
Bought by
Al Haq Irfan
Home Financials for this Owner
Home Financials are based on the most recent Mortgage that was taken out on this home.
Original Mortgage
$308,750
Outstanding Balance
$274,617
Interest Rate
2.9%
Mortgage Type
New Conventional
Estimated Equity
$192,878
Purchase Details
Closed on
Jun 20, 2013
Sold by
Roberts Laurie and Roberts Laurie B
Bought by
Roberts Laurie
Home Financials for this Owner
Home Financials are based on the most recent Mortgage that was taken out on this home.
Original Mortgage
$82,000
Interest Rate
3.38%
Mortgage Type
New Conventional
Purchase Details
Closed on
Apr 11, 2011
Sold by
Roberts Laurie B and Roberts Laurie
Bought by
Roberts Laurie B
Home Financials for this Owner
Home Financials are based on the most recent Mortgage that was taken out on this home.
Original Mortgage
$85,000
Interest Rate
4.83%
Mortgage Type
New Conventional
Purchase Details
Closed on
Sep 23, 2005
Sold by
Jimenez Abel A and Roberts Laurie
Bought by
Roberts Laurie
Purchase Details
Closed on
Aug 9, 2002
Sold by
Neal Lorry
Bought by
Jimenez Abel A and Roberts Laurie
Home Financials for this Owner
Home Financials are based on the most recent Mortgage that was taken out on this home.
Original Mortgage
$126,875
Interest Rate
6.43%
Mortgage Type
FHA
Purchase Details
Closed on
Jan 10, 2001
Sold by
Farrell Alex R
Bought by
Neal Lorry
Home Financials for this Owner
Home Financials are based on the most recent Mortgage that was taken out on this home.
Original Mortgage
$111,000
Interest Rate
7.54%
Purchase Details
Closed on
Nov 20, 1998
Sold by
Farrel Alex R
Bought by
Farrel Alex R
Home Financials for this Owner
Home Financials are based on the most recent Mortgage that was taken out on this home.
Original Mortgage
$101,800
Interest Rate
6.78%
Purchase Details
Closed on
May 31, 1995
Sold by
Kaufman & Broad Of Nevada Inc
Bought by
Farrel Alex R
Home Financials for this Owner
Home Financials are based on the most recent Mortgage that was taken out on this home.
Original Mortgage
$102,350
Interest Rate
8.32%
Create a Home Valuation Report for This Property
The Home Valuation Report is an in-depth analysis detailing your home's value as well as a comparison with similar homes in the area
Home Values in the Area
Average Home Value in this Area
Purchase History
| Date | Buyer | Sale Price | Title Company |
|---|---|---|---|
| Al Haq Irfan | -- | Fidelity National Title | |
| Al Haq Irfan | $325,000 | Fidelity National Title | |
| Roberts Laurie | -- | Chicago Title Las Vegas | |
| Roberts Laurie B | -- | Old Republic Title Company | |
| Roberts Laurie | -- | -- | |
| Jimenez Abel A | $175,000 | Fidelity National Title | |
| Neal Lorry | $162,000 | First American Title Co | |
| Farrel Alex R | -- | United Title | |
| Farrel Alex R | $128,000 | First American Title Company |
Source: Public Records
Mortgage History
| Date | Status | Borrower | Loan Amount |
|---|---|---|---|
| Open | Al Haq Irfan | $308,750 | |
| Previous Owner | Roberts Laurie | $82,000 | |
| Previous Owner | Roberts Laurie B | $85,000 | |
| Previous Owner | Jimenez Abel A | $126,875 | |
| Previous Owner | Neal Lorry | $111,000 | |
| Previous Owner | Farrel Alex R | $101,800 | |
| Previous Owner | Farrel Alex R | $102,350 |
Source: Public Records
Tax History Compared to Growth
Tax History
| Year | Tax Paid | Tax Assessment Tax Assessment Total Assessment is a certain percentage of the fair market value that is determined by local assessors to be the total taxable value of land and additions on the property. | Land | Improvement |
|---|---|---|---|---|
| 2025 | $2,213 | $94,818 | $37,100 | $57,718 |
| 2024 | $2,050 | $94,818 | $37,100 | $57,718 |
| 2023 | $2,050 | $87,315 | $32,375 | $54,940 |
| 2022 | $1,898 | $78,503 | $28,000 | $50,503 |
| 2021 | $1,758 | $72,699 | $24,500 | $48,199 |
| 2020 | $1,629 | $71,980 | $24,150 | $47,830 |
| 2019 | $1,582 | $67,615 | $20,300 | $47,315 |
| 2018 | $1,536 | $62,638 | $17,150 | $45,488 |
| 2017 | $1,837 | $63,341 | $17,150 | $46,191 |
| 2016 | $1,455 | $57,979 | $11,550 | $46,429 |
| 2015 | $1,451 | $56,081 | $10,150 | $45,931 |
| 2014 | $1,409 | $49,662 | $8,050 | $41,612 |
Source: Public Records
Map
Nearby Homes
- 2494 Via di Autostrada
- 2427 Worchester Rd
- 37 Bishopsgate Terrace
- 6 High Sierra Dr
- 2505 Cortina Ave
- 2561 Diplomacy Pointe Ct
- 247 Integrity Ridge Dr
- 36 Tidwell Ln
- 58 Pleasant Dale Dr
- 2412 Eagleridge Dr
- 2802 Camelback Ln
- 43 Fantasia Ln
- 269 Jaramillo Ct
- 264 Faith Filled Ct
- 2428 Devotion Ridge Dr
- 8953 Belconte Ln
- 112 Wynntry Dr
- 107 Tapatio St Unit 83
- 2827 Richmar Ave
- 2458 Tour Edition Dr
- 2512 Via di Autostrada
- 2508 Via di Autostrada
- 2514 Via di Autostrada
- 2546 Via di Autostrada
- 2548 Via di Autostrada
- 2550 Via di Autostrada
- 2544 Via di Autostrada
- 2506 Via di Autostrada Unit 1
- 2542 Via di Autostrada
- 2516 Via di Autostrada
- 2509 Via di Autostrada
- 2552 Via di Autostrada
- 2511 Via di Autostrada
- 2540 Via di Autostrada
- 2504 Via di Autostrada
- 2513 Via di Autostrada
- 2518 Via di Autostrada
- 2515 Via di Autostrada
- 2502 Via di Autostrada
- 2538 Via di Autostrada