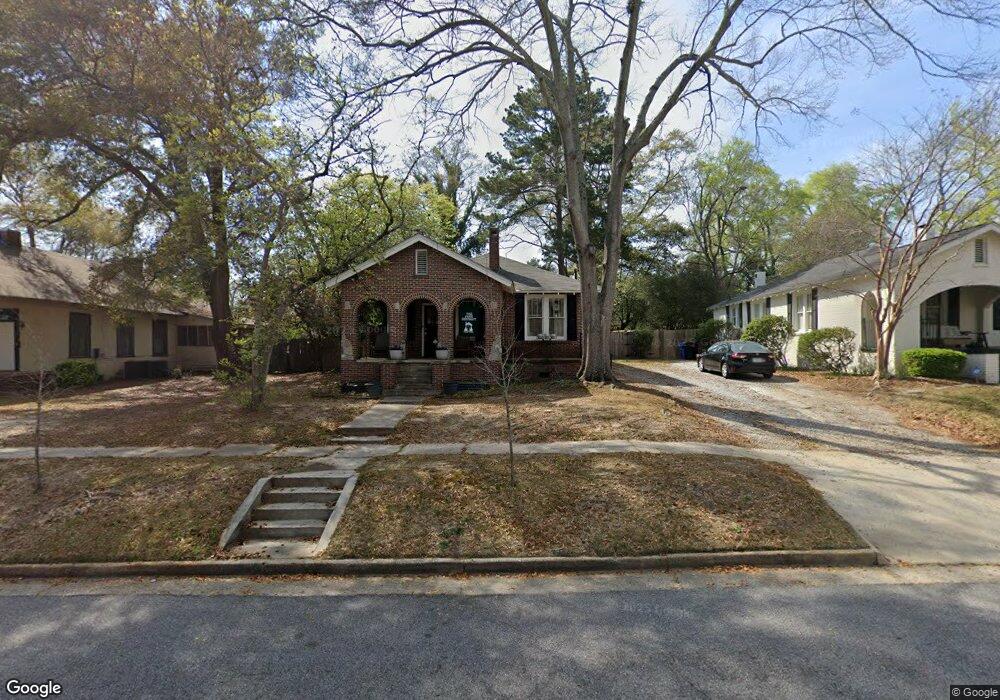
2511 18th Ave Columbus, GA 31901
Saint Elmo Weracoba NeighborhoodEstimated Value: $222,000 - $238,000
3
Beds
2
Baths
1,426
Sq Ft
$162/Sq Ft
Est. Value
About This Home
This home is located at 2511 18th Ave, Columbus, GA 31901 and is currently estimated at $231,705, approximately $162 per square foot. 2511 18th Ave is a home located in Muscogee County with nearby schools including Clubview Elementary School, Richards Middle School, and Jordan Vocational High School.
Ownership History
Date
Name
Owned For
Owner Type
Purchase Details
Closed on
Nov 20, 2020
Sold by
Salmo Andrew
Bought by
Burnett Catherine Elizabeth
Current Estimated Value
Home Financials for this Owner
Home Financials are based on the most recent Mortgage that was taken out on this home.
Original Mortgage
$151,750
Outstanding Balance
$134,256
Interest Rate
2.8%
Mortgage Type
New Conventional
Estimated Equity
$97,449
Purchase Details
Closed on
Jul 30, 2010
Sold by
Salmo Andrew
Bought by
Salmo Andrew and Salmo Jessica
Home Financials for this Owner
Home Financials are based on the most recent Mortgage that was taken out on this home.
Original Mortgage
$183,767
Interest Rate
4.83%
Mortgage Type
VA
Purchase Details
Closed on
Jun 30, 2010
Sold by
Knight Patrick
Bought by
Salmo Andrew
Home Financials for this Owner
Home Financials are based on the most recent Mortgage that was taken out on this home.
Original Mortgage
$183,767
Interest Rate
4.83%
Mortgage Type
VA
Purchase Details
Closed on
Nov 17, 2009
Sold by
Hawes Benjamin W
Bought by
Knight Patrick
Create a Home Valuation Report for This Property
The Home Valuation Report is an in-depth analysis detailing your home's value as well as a comparison with similar homes in the area
Home Values in the Area
Average Home Value in this Area
Purchase History
| Date | Buyer | Sale Price | Title Company |
|---|---|---|---|
| Burnett Catherine Elizabeth | $165,000 | -- | |
| Salmo Andrew | $179,900 | None Available | |
| Salmo Andrew | $179,900 | None Available | |
| Knight Patrick | $50,000 | None Available |
Source: Public Records
Mortgage History
| Date | Status | Borrower | Loan Amount |
|---|---|---|---|
| Open | Burnett Catherine Elizabeth | $151,750 | |
| Previous Owner | Salmo Andrew | $183,767 |
Source: Public Records
Tax History Compared to Growth
Tax History
| Year | Tax Paid | Tax Assessment Tax Assessment Total Assessment is a certain percentage of the fair market value that is determined by local assessors to be the total taxable value of land and additions on the property. | Land | Improvement |
|---|---|---|---|---|
| 2025 | $2,068 | $76,828 | $7,968 | $68,860 |
| 2024 | $2,066 | $76,828 | $7,968 | $68,860 |
| 2023 | $1,385 | $76,828 | $7,968 | $68,860 |
| 2022 | $2,155 | $64,156 | $7,968 | $56,188 |
| 2021 | $2,148 | $66,000 | $7,920 | $58,080 |
| 2020 | $1,702 | $41,664 | $7,968 | $33,696 |
| 2019 | $1,707 | $41,664 | $7,968 | $33,696 |
| 2018 | $1,707 | $41,664 | $7,968 | $33,696 |
| 2017 | $1,712 | $41,664 | $7,968 | $33,696 |
| 2016 | $2,968 | $71,959 | $5,652 | $66,307 |
| 2015 | $2,972 | $71,959 | $5,652 | $66,307 |
| 2014 | $2,976 | $71,959 | $5,652 | $66,307 |
| 2013 | -- | $71,959 | $5,652 | $66,307 |
Source: Public Records
Map
Nearby Homes
- 2420 16th Ave
- 2424 16th Ave
- 2416 16th Ave
- 2512 19th Ave
- 1424 26th St
- 1450 23rd St
- 2230 Cherokee Ave Unit 10
- 3011 18th Ave
- 1719 Slade Dr
- 1432 22nd St
- 1447 21st St
- 2104 Cherokee Ave
- 3105 Woodlawn Ave
- 1810 Shannon Dr
- 2810 Pierpont Ave
- 1438 21st St
- 1314 Talbotton Rd
- 1346 22nd St
- 1525 19th St
- 3111 15th Ave