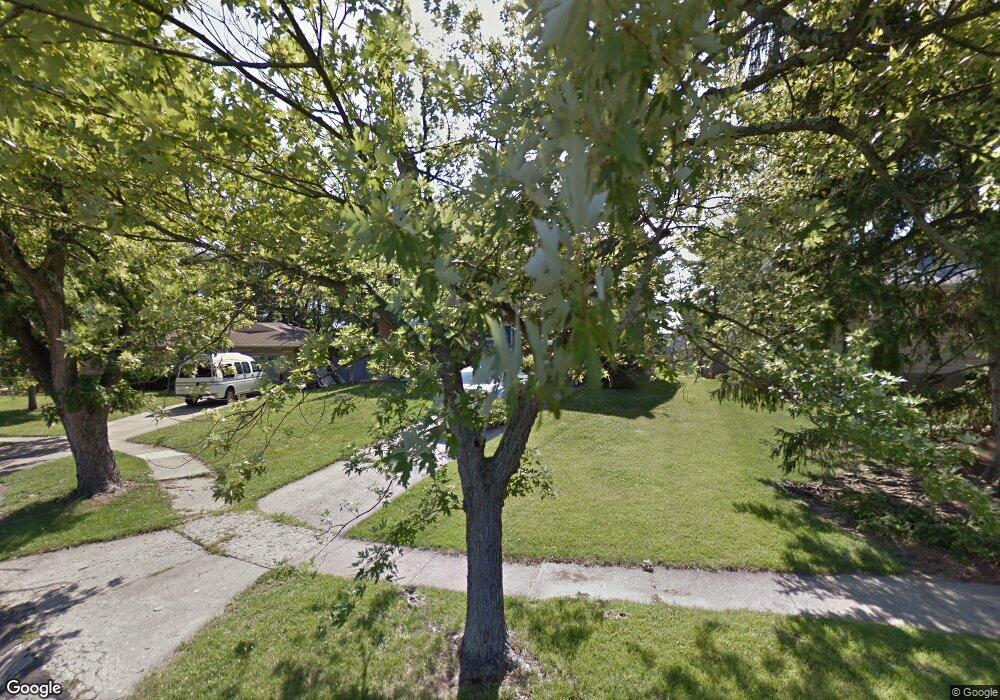
2511 Byrneside Dr Cincinnati, OH 45239
Estimated Value: $230,000 - $267,000
4
Beds
3
Baths
1,696
Sq Ft
$143/Sq Ft
Est. Value
About This Home
This home is located at 2511 Byrneside Dr, Cincinnati, OH 45239 and is currently estimated at $242,556, approximately $143 per square foot. 2511 Byrneside Dr is a home located in Hamilton County with nearby schools including White Oak Middle School, Colerain High School, and Cincinnati Achievement Academy.
Ownership History
Date
Name
Owned For
Owner Type
Purchase Details
Closed on
Sep 10, 2019
Sold by
Belser Linda E
Bought by
Davis Dianne V
Current Estimated Value
Purchase Details
Closed on
Aug 22, 2000
Sold by
Miller Clay R and Miller Amy M
Bought by
Belser Linda E
Home Financials for this Owner
Home Financials are based on the most recent Mortgage that was taken out on this home.
Original Mortgage
$113,050
Interest Rate
8.26%
Purchase Details
Closed on
Oct 30, 1997
Sold by
Thompson Mark A and Thompson Melissa A
Bought by
Miller Clay R and Miller Amy M
Home Financials for this Owner
Home Financials are based on the most recent Mortgage that was taken out on this home.
Original Mortgage
$85,500
Interest Rate
7.42%
Create a Home Valuation Report for This Property
The Home Valuation Report is an in-depth analysis detailing your home's value as well as a comparison with similar homes in the area
Home Values in the Area
Average Home Value in this Area
Purchase History
| Date | Buyer | Sale Price | Title Company |
|---|---|---|---|
| Davis Dianne V | -- | None Available | |
| Belser Linda E | $119,000 | -- | |
| Miller Clay R | $97,000 | -- |
Source: Public Records
Mortgage History
| Date | Status | Borrower | Loan Amount |
|---|---|---|---|
| Previous Owner | Belser Linda E | $113,050 | |
| Previous Owner | Miller Clay R | $85,500 |
Source: Public Records
Tax History
| Year | Tax Paid | Tax Assessment Tax Assessment Total Assessment is a certain percentage of the fair market value that is determined by local assessors to be the total taxable value of land and additions on the property. | Land | Improvement |
|---|---|---|---|---|
| 2025 | $3,697 | $61,838 | $9,569 | $52,269 |
| 2024 | $3,512 | $61,838 | $9,569 | $52,269 |
| 2023 | $3,471 | $61,838 | $9,569 | $52,269 |
| 2022 | $2,260 | $33,758 | $7,483 | $26,275 |
| 2021 | $2,240 | $33,758 | $7,483 | $26,275 |
| 2020 | $2,263 | $33,758 | $7,483 | $26,275 |
| 2019 | $2,057 | $28,609 | $6,342 | $22,267 |
| 2018 | $1,848 | $28,609 | $6,342 | $22,267 |
| 2017 | $1,753 | $28,609 | $6,342 | $22,267 |
| 2016 | $2,212 | $35,823 | $8,722 | $27,101 |
| 2015 | $2,233 | $35,823 | $8,722 | $27,101 |
| 2014 | $2,237 | $35,823 | $8,722 | $27,101 |
| 2013 | $2,320 | $38,938 | $9,482 | $29,456 |
Source: Public Records
Map
Nearby Homes
- 2405 Amelia Ct
- 2427 Crosley Meadow
- 2424 Banning Rd
- 2391 Deblin Dr
- 2503 Flanigan Ct
- 2342 Banning Rd
- 2268 Deblin Dr
- 7170 Longwood Ct
- 2806 Breezy Way
- 2757 Banning Rd
- 2801 Byrneside Dr
- 2820 Geraldine Dr
- 5970 Colerain Ave
- 2603 Kipling Ave
- 2171 Lincoln Ave
- 2125 Mckinley Ave
- 2030 Emerson Ave
- 2897 Blue Rock Rd
- 2048 4th Ave
- 5734 Wielert Ave
- 2515 Byrneside Dr
- 2505 Byrneside Dr
- 2519 Byrneside Dr
- 2502 Highwood Ln
- 2519 Highwood Ln
- 2510 Highwood Ln
- 2523 Byrneside Dr
- 2518 Highwood Ln
- 2518 Byrneside Dr
- 2527 Byrneside Dr
- 2531 Highwood Ln
- 2522 Byrneside Dr
- 2526 Highwood Ln
- 2425 Amelia Ct
- 2429 Amelia Ct
- 2526 Byrneside Dr
- 2421 Amelia Ct
- 2531 Byrneside Dr
- 2433 Amelia Ct
- 2537 Highwood Ln
Your Personal Tour Guide
Ask me questions while you tour the home.