Estimated Value: $325,000 - $339,062
5
Beds
3
Baths
2,410
Sq Ft
$137/Sq Ft
Est. Value
About This Home
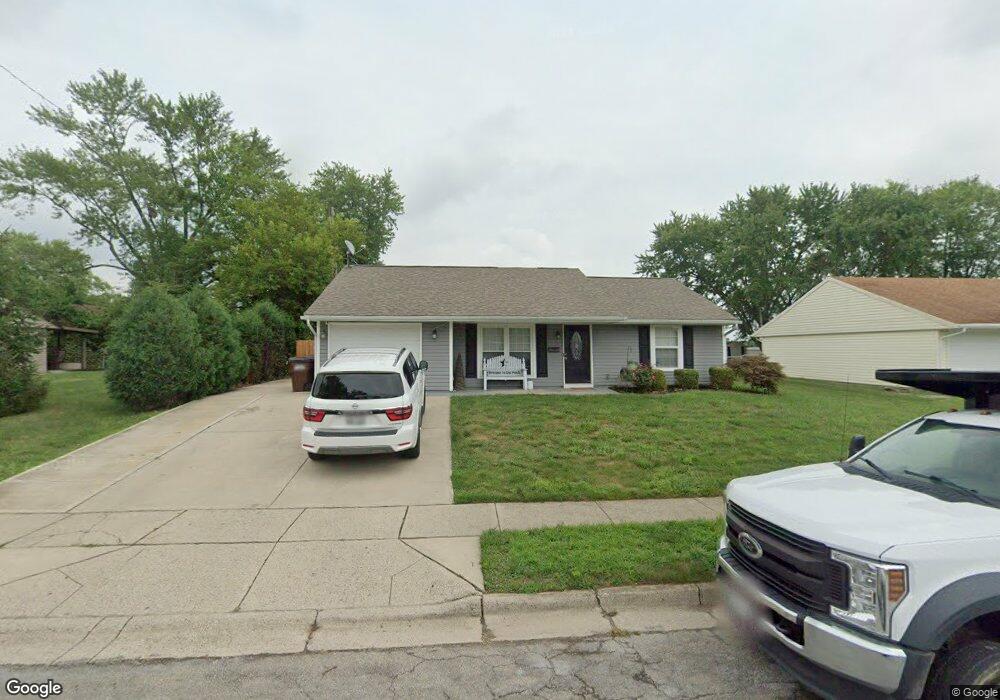
This home is located at 2511 Cornwall Dr, Xenia, OH 45385 and is currently estimated at $331,266, approximately $137 per square foot. 2511 Cornwall Dr is a home located in Greene County with nearby schools including Xenia High School, Summit Academy Community School for Alternative Learners - Xenia, and Legacy Christian Academy.
Ownership History
Date
Name
Owned For
Owner Type
Purchase Details
Closed on
Oct 17, 2022
Sold by
Solis Jose A and Solis Melissa
Bought by
White Tammy and White Kevin
Current Estimated Value
Home Financials for this Owner
Home Financials are based on the most recent Mortgage that was taken out on this home.
Original Mortgage
$224,000
Outstanding Balance
$215,524
Interest Rate
6.02%
Mortgage Type
New Conventional
Estimated Equity
$115,742
Purchase Details
Closed on
Aug 18, 2011
Sold by
Salazar Guadalupe T and Salazar Brenda L
Bought by
Solis Jose A and Solis Melissa
Home Financials for this Owner
Home Financials are based on the most recent Mortgage that was taken out on this home.
Original Mortgage
$57,500
Interest Rate
4.4%
Mortgage Type
Seller Take Back
Purchase Details
Closed on
Mar 27, 1998
Sold by
Hartpence Deborah L
Bought by
Salazar Guadalupe T and Salazar Brenda L
Home Financials for this Owner
Home Financials are based on the most recent Mortgage that was taken out on this home.
Original Mortgage
$74,529
Interest Rate
7.09%
Mortgage Type
FHA
Create a Home Valuation Report for This Property
The Home Valuation Report is an in-depth analysis detailing your home's value as well as a comparison with similar homes in the area
Home Values in the Area
Average Home Value in this Area
Purchase History
| Date | Buyer | Sale Price | Title Company |
|---|---|---|---|
| White Tammy | -- | -- | |
| Solis Jose A | $60,000 | Attorney | |
| Salazar Guadalupe T | $74,900 | -- |
Source: Public Records
Mortgage History
| Date | Status | Borrower | Loan Amount |
|---|---|---|---|
| Open | White Tammy | $224,000 | |
| Previous Owner | Solis Jose A | $57,500 | |
| Previous Owner | Salazar Guadalupe T | $74,529 |
Source: Public Records
Tax History Compared to Growth
Tax History
| Year | Tax Paid | Tax Assessment Tax Assessment Total Assessment is a certain percentage of the fair market value that is determined by local assessors to be the total taxable value of land and additions on the property. | Land | Improvement |
|---|---|---|---|---|
| 2024 | $3,143 | $75,390 | $17,110 | $58,280 |
| 2023 | $3,143 | $75,390 | $17,110 | $58,280 |
| 2022 | $2,686 | $53,550 | $10,070 | $43,480 |
| 2021 | $2,723 | $53,550 | $10,070 | $43,480 |
| 2020 | $2,609 | $53,550 | $10,070 | $43,480 |
| 2019 | $2,244 | $43,360 | $7,960 | $35,400 |
| 2018 | $2,252 | $43,360 | $7,960 | $35,400 |
| 2017 | $1,338 | $43,360 | $7,960 | $35,400 |
| 2016 | $1,339 | $25,290 | $7,960 | $17,330 |
| 2015 | $1,352 | $25,460 | $7,960 | $17,500 |
| 2014 | $1,294 | $25,460 | $7,960 | $17,500 |
Source: Public Records
Map
Nearby Homes
- 2540 Cornwall Dr
- 2540 Jenny Marie Dr
- 2421 Louisiana Dr
- 2499 Jenny Marie Dr
- 0 Berkshire Dr Unit 942854
- 1107 Arkansas Dr
- 2345 Tennessee Dr
- 1255 Colorado Dr
- 2784 Greystoke Dr
- 1908 Whitt St
- 2821 Raxit Ct
- 1866 Roxbury Dr
- 2705 Tennessee Dr
- 2144 Tandem Dr
- 1318 Prem Place
- 2692 Kingman Dr
- 2257 Maryland Dr
- 1829 Gayhart Dr
- 1248 Prem Place
- 910 Wright Ave
- 2525 Cornwall Dr
- 2497 Cornwall Dr
- 2173 Windsor Dr
- 2539 Cornwall Dr
- 2159 Windsor Dr
- 2512 Cornwall Dr
- 2526 Cornwall Dr
- 2498 Cornwall Dr
- 2553 Cornwall Dr
- 1349 Berkshire Dr
- 2484 Cornwall Dr
- 2145 Windsor Dr
- 2188 Windsor Dr
- 2174 Windsor Dr
- 2470 Cornwall Dr
- 2160 Windsor Dr
- 1323 Berkshire Dr
- 2146 Windsor Dr
- 2456 Cornwall Dr
- 1340 Berkshire Dr