Estimated Value: $212,606 - $224,000
3
Beds
2
Baths
1,359
Sq Ft
$161/Sq Ft
Est. Value
About This Home
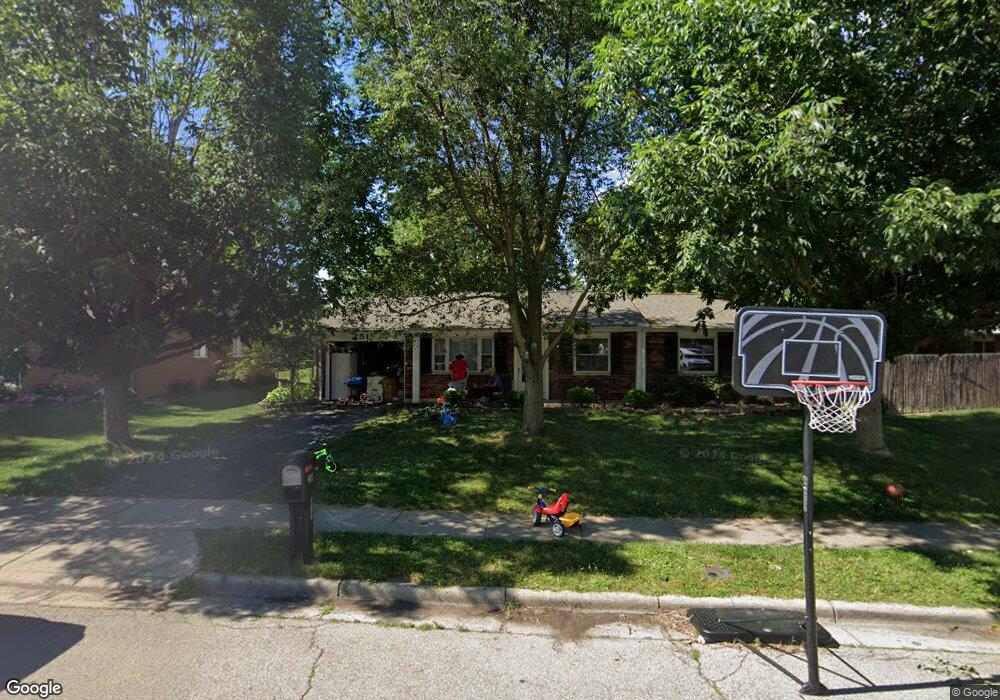
This home is located at 2511 Galway Ct, Troy, OH 45373 and is currently estimated at $218,402, approximately $160 per square foot. 2511 Galway Ct is a home located in Miami County with nearby schools including Hook Elementary School, Troy Junior High School, and Van Cleve Elementary School.
Ownership History
Date
Name
Owned For
Owner Type
Purchase Details
Closed on
Apr 16, 2020
Sold by
Gaerke Todd S and Todd S Gaerke Revocable Living
Bought by
Lancer Holdings Llc
Current Estimated Value
Purchase Details
Closed on
Apr 6, 2018
Sold by
Gaerke Todd S and Gaerke Shelie D
Bought by
Gaerke Trust
Purchase Details
Closed on
Aug 18, 2008
Sold by
Gaerke Dianne M
Bought by
Gaerke Todd and Gaerke Troy
Purchase Details
Closed on
Jul 20, 2001
Sold by
Carr Todd Allen and Carr Denise Lynn
Bought by
Gaerke Dianne M
Home Financials for this Owner
Home Financials are based on the most recent Mortgage that was taken out on this home.
Original Mortgage
$62,000
Interest Rate
7.22%
Mortgage Type
New Conventional
Purchase Details
Closed on
May 14, 1996
Sold by
Fairchild Sally D
Bought by
Carr Todd A and Carr Denise L
Purchase Details
Closed on
Aug 1, 1986
Bought by
Fairchild Sally D
Create a Home Valuation Report for This Property
The Home Valuation Report is an in-depth analysis detailing your home's value as well as a comparison with similar homes in the area
Home Values in the Area
Average Home Value in this Area
Purchase History
| Date | Buyer | Sale Price | Title Company |
|---|---|---|---|
| Lancer Holdings Llc | -- | None Available | |
| Gaerke Trust | $79,050 | None Available | |
| Gaerke Todd | -- | -- | |
| Gaerke Dianne M | $99,500 | -- | |
| Carr Todd A | $89,000 | -- | |
| Fairchild Sally D | $40,500 | -- |
Source: Public Records
Mortgage History
| Date | Status | Borrower | Loan Amount |
|---|---|---|---|
| Previous Owner | Gaerke Dianne M | $62,000 |
Source: Public Records
Tax History Compared to Growth
Tax History
| Year | Tax Paid | Tax Assessment Tax Assessment Total Assessment is a certain percentage of the fair market value that is determined by local assessors to be the total taxable value of land and additions on the property. | Land | Improvement |
|---|---|---|---|---|
| 2024 | $1,960 | $50,900 | $10,190 | $40,710 |
| 2023 | $1,960 | $50,900 | $10,190 | $40,710 |
| 2022 | $1,640 | $50,900 | $10,190 | $40,710 |
| 2021 | $1,233 | $36,370 | $7,280 | $29,090 |
| 2020 | $1,235 | $36,370 | $7,280 | $29,090 |
| 2019 | $1,246 | $36,370 | $7,280 | $29,090 |
| 2018 | $1,104 | $30,980 | $7,560 | $23,420 |
| 2017 | $1,116 | $30,980 | $7,560 | $23,420 |
| 2016 | $1,100 | $30,980 | $7,560 | $23,420 |
| 2015 | $1,104 | $29,790 | $7,280 | $22,510 |
| 2014 | $1,104 | $29,790 | $7,280 | $22,510 |
| 2013 | $1,111 | $29,790 | $7,280 | $22,510 |
Source: Public Records
Map
Nearby Homes
- 2511 Glenmore Ct
- 2513 Glenmore Ct
- 2722-2724 Fairview Ct
- 2600 Meadowpoint Dr
- 2791 Meadowpoint Dr
- 2455 Lupine Ct
- 2365 Murphy Ln W
- 1645 Cornish Rd
- 2290 Murphy Ln E
- 2430 Coriander Ct
- 622 Windsor Rd
- 1601 Henley Rd
- 1248 Waterbury Place
- 2261 Lytle Rd
- 2267 Lytle Rd
- 2273 Lytle Rd
- 2279 Lytle Rd
- 2319 Lytle Rd
- 2359 Lytle Rd
- Tupelo Plan at Addison Landing - Single Family Homes
- 2513 Galway Ct
- 2406 New Castle Dr
- 2512 Glenmore Ct
- 2514 Glenmore Ct
- 2515 Galway Ct
- 2510 Glenmore Ct
- 2510 Galway Ct
- 2512 Galway Ct
- 2516 Glenmore Ct
- 2514 Galway Ct
- 2517 Galway Ct
- 2409 New Castle Dr
- 2402 New Castle Dr
- 2516 Galway Ct
- 2518 Glenmore Ct
- 2405 New Castle Dr
- 2519 Galway Ct
- 2413 New Castle Dr
- 2515 Glenmore Ct
- 2518 Galway Ct