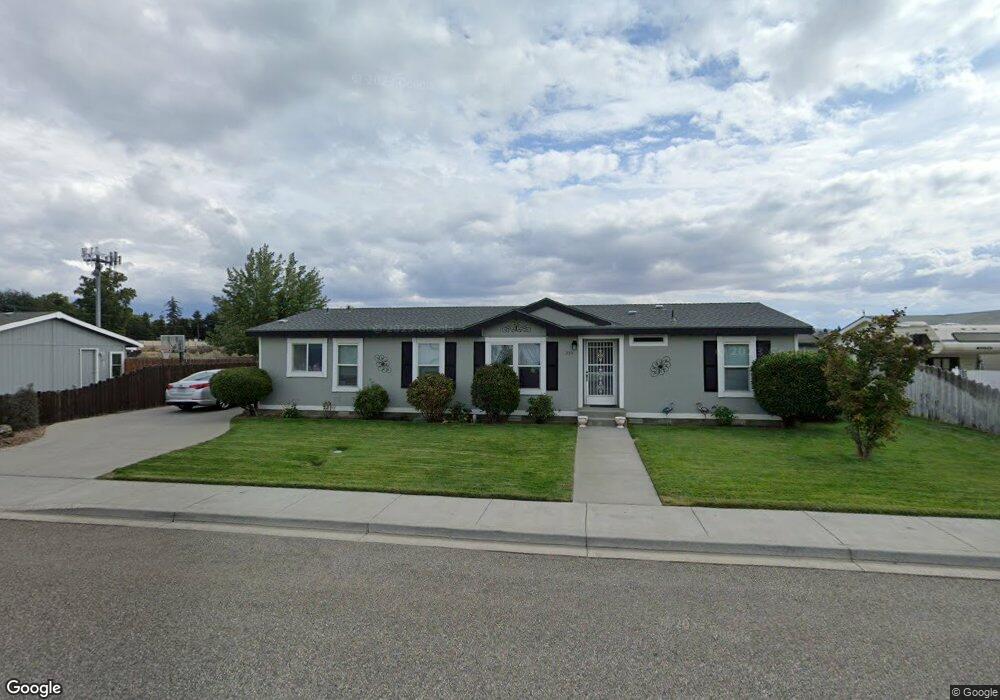
2511 Glenbriar Ln Richland, WA 99352
Estimated Value: $319,000 - $380,000
4
Beds
2
Baths
1,456
Sq Ft
$232/Sq Ft
Est. Value
About This Home
This home is located at 2511 Glenbriar Ln, Richland, WA 99352 and is currently estimated at $337,128, approximately $231 per square foot. 2511 Glenbriar Ln is a home located in Benton County with nearby schools including Tapteal Elementary School, Carmichael Middle School, and Hanford High School.
Ownership History
Date
Name
Owned For
Owner Type
Purchase Details
Closed on
Nov 16, 2020
Sold by
Young Roger S
Bought by
Dreyer Pam
Current Estimated Value
Home Financials for this Owner
Home Financials are based on the most recent Mortgage that was taken out on this home.
Original Mortgage
$176,800
Outstanding Balance
$157,327
Interest Rate
2.8%
Mortgage Type
New Conventional
Estimated Equity
$179,801
Purchase Details
Closed on
Oct 23, 2007
Sold by
Va
Bought by
Young Roger S
Home Financials for this Owner
Home Financials are based on the most recent Mortgage that was taken out on this home.
Original Mortgage
$111,649
Interest Rate
6.38%
Mortgage Type
VA
Purchase Details
Closed on
Aug 30, 2006
Sold by
Gmac Mortgage Corp
Bought by
Va
Purchase Details
Closed on
Aug 28, 2006
Sold by
Velasco Joe and Velasco Tracy
Bought by
Gmac Mortgage Corp
Create a Home Valuation Report for This Property
The Home Valuation Report is an in-depth analysis detailing your home's value as well as a comparison with similar homes in the area
Home Values in the Area
Average Home Value in this Area
Purchase History
| Date | Buyer | Sale Price | Title Company |
|---|---|---|---|
| Dreyer Pam | $221,000 | Ticor Title Company | |
| Young Roger S | -- | Chicago Title | |
| Va | -- | Frontier Title & Esc | |
| Gmac Mortgage Corp | $108,400 | Frontier Title & Esc |
Source: Public Records
Mortgage History
| Date | Status | Borrower | Loan Amount |
|---|---|---|---|
| Open | Dreyer Pam | $176,800 | |
| Previous Owner | Young Roger S | $111,649 |
Source: Public Records
Tax History Compared to Growth
Tax History
| Year | Tax Paid | Tax Assessment Tax Assessment Total Assessment is a certain percentage of the fair market value that is determined by local assessors to be the total taxable value of land and additions on the property. | Land | Improvement |
|---|---|---|---|---|
| 2024 | $1,982 | $181,000 | $60,000 | $121,000 |
| 2023 | $1,982 | $208,920 | $60,000 | $148,920 |
| 2022 | $2,121 | $196,510 | $60,000 | $136,510 |
| 2021 | $2,134 | $190,310 | $60,000 | $130,310 |
| 2020 | $1,543 | $184,100 | $60,000 | $124,100 |
| 2019 | $1,518 | $125,150 | $60,000 | $65,150 |
| 2018 | $1,590 | $132,780 | $35,000 | $97,780 |
| 2017 | $1,392 | $116,480 | $35,000 | $81,480 |
| 2016 | $1,372 | $116,480 | $35,000 | $81,480 |
| 2015 | $1,398 | $116,480 | $35,000 | $81,480 |
| 2014 | -- | $116,480 | $35,000 | $81,480 |
| 2013 | -- | $116,480 | $35,000 | $81,480 |
Source: Public Records
Map
Nearby Homes
- 617 Cottonwood Dr
- 627 Cedar Ave
- 405 Basswood Ave
- 2407 Duportail St
- 2402 Dover St
- 733 Tanglewood Dr
- 2404 Dallas St
- 2109 Duportail St
- 2120 Duportail St Unit 1
- 2305 Concord St
- 503 Wright Ave Unit B8
- 711 Cottonwood Loop
- 505 Winslow Ave
- 513 Winslow Ave
- 901 Cedar Ave
- 667 Lonetree Ln
- 677 Lonetree Ln
- 692 Lonetree Ln
- 681 Lonetree Ln
- 811 Wright Ave
- 2519 Glenbriar Ln
- 2519 Glenbriar Ln Unit Immaculate home in g
- 2503 Glenbriar Ln
- 2503 Glen Briar Ln
- 2527 Glenbriar Ln
- 556 Laurelbrook Ct
- 2502 Glenbriar Ln
- 2510 Glenbriar Ln
- 568 Riverstone Dr
- 566 Laurelbrook Ct
- 576 Riverstone Dr
- 2535 Glenbriar Ln
- 2534 Glenbriar Ln
- 583 Riverstone Dr
- 580 Riverstone Dr
- 570 Riverstone Dr
- 588 Laurelbrook Ct
- 588 Laurelbrook Ct Unit 4 Bedroom, 3 Bath fo
- 574 Laurelbrook Ct
- 574 Laurelbrook Ct Unit Convenient location,