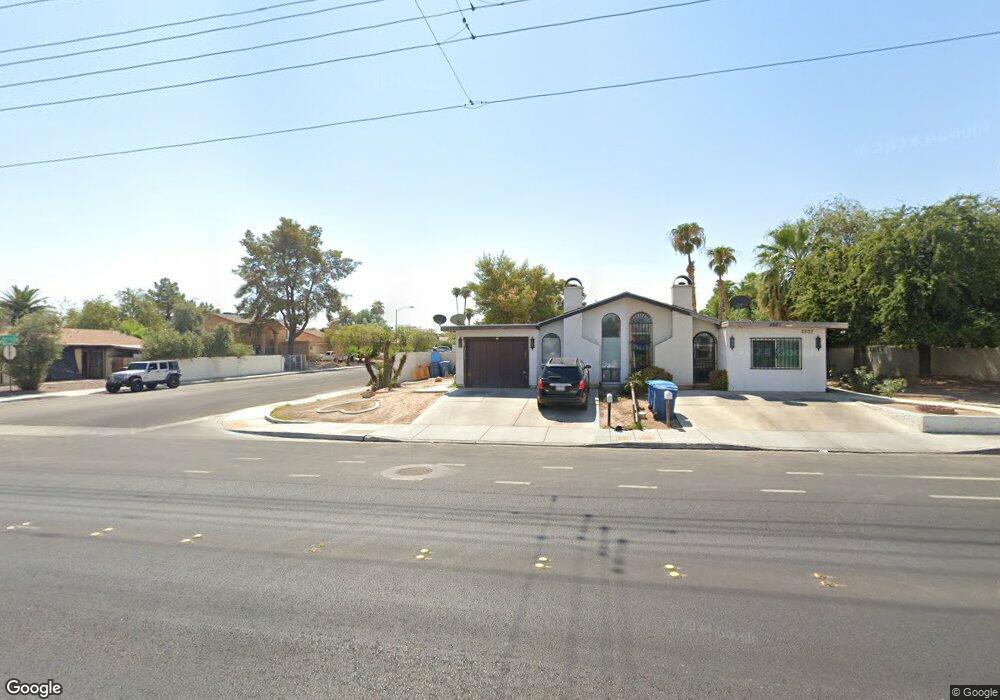
2511 Karen Ave Las Vegas, NV 89121
Estimated Value: $215,209 - $273,000
2
Beds
2
Baths
1,190
Sq Ft
$209/Sq Ft
Est. Value
About This Home
This home is located at 2511 Karen Ave, Las Vegas, NV 89121 and is currently estimated at $248,802, approximately $209 per square foot. 2511 Karen Ave is a home located in Clark County with nearby schools including Will Beckley Elementary School, Knudson Academy of the Arts, and Valley High School.
Ownership History
Date
Name
Owned For
Owner Type
Purchase Details
Closed on
Sep 25, 2009
Sold by
Narang Hari
Bought by
Narang Hari and Narang Sarju
Current Estimated Value
Purchase Details
Closed on
May 1, 2001
Sold by
Burke Corrine K
Bought by
Federal Home Loan Mortgage Corporation
Purchase Details
Closed on
Mar 10, 1994
Sold by
Rabon Mark S
Bought by
Burke Corrine K
Home Financials for this Owner
Home Financials are based on the most recent Mortgage that was taken out on this home.
Original Mortgage
$90,150
Interest Rate
7%
Purchase Details
Closed on
Jan 24, 1994
Sold by
Rabon Audrey H
Bought by
Rabon Mark S
Home Financials for this Owner
Home Financials are based on the most recent Mortgage that was taken out on this home.
Original Mortgage
$90,150
Interest Rate
7%
Create a Home Valuation Report for This Property
The Home Valuation Report is an in-depth analysis detailing your home's value as well as a comparison with similar homes in the area
Home Values in the Area
Average Home Value in this Area
Purchase History
| Date | Buyer | Sale Price | Title Company |
|---|---|---|---|
| Narang Hari | -- | None Available | |
| Narang Sarju | -- | None Available | |
| Narang Hari | -- | None Available | |
| Federal Home Loan Mortgage Corporation | $72,401 | Stewart Title | |
| Burke Corrine K | $95,000 | Land Title | |
| Rabon Mark S | -- | Land Title |
Source: Public Records
Mortgage History
| Date | Status | Borrower | Loan Amount |
|---|---|---|---|
| Previous Owner | Burke Corrine K | $90,150 |
Source: Public Records
Tax History Compared to Growth
Tax History
| Year | Tax Paid | Tax Assessment Tax Assessment Total Assessment is a certain percentage of the fair market value that is determined by local assessors to be the total taxable value of land and additions on the property. | Land | Improvement |
|---|---|---|---|---|
| 2025 | $605 | $40,968 | $17,850 | $23,118 |
| 2024 | $588 | $40,968 | $17,850 | $23,118 |
| 2023 | $617 | $44,029 | $22,050 | $21,979 |
| 2022 | $599 | $37,036 | $15,750 | $21,286 |
| 2021 | $555 | $33,419 | $15,750 | $17,669 |
| 2020 | $536 | $29,607 | $10,850 | $18,757 |
| 2019 | $529 | $28,032 | $9,100 | $18,932 |
| 2018 | $505 | $26,450 | $8,050 | $18,400 |
| 2017 | $752 | $25,649 | $7,000 | $18,649 |
| 2016 | $480 | $24,016 | $4,550 | $19,466 |
| 2015 | $477 | $17,136 | $4,550 | $12,586 |
| 2014 | -- | $15,293 | $3,850 | $11,443 |
Source: Public Records
Map
Nearby Homes
- 2451 Old Forge Ln Unit 105
- 2471 Old Forge Ln Unit 105
- 2680 Karen Ave
- 2759 Long Ct
- 2657 Kline Cir
- 2460 Old Forge Ln Unit 48
- 2430 Old Forge Ln Unit 106
- 2420 Old Forge Ln Unit 104
- 2909 Pacific Ave
- 2659 Vegas Valley Dr
- 2432 Palma Vista Ave
- 2761 Phoenix St
- 2491 Capistrano Ave
- 2346 Capistrano Ave
- 3030 Liberty Cir N
- 0 Robar St Unit 2718009
- 2825 Burnham Ave
- 2824 El Toreador St
- 3056 Ocotillo Ct
- 2944 Burnham Ave