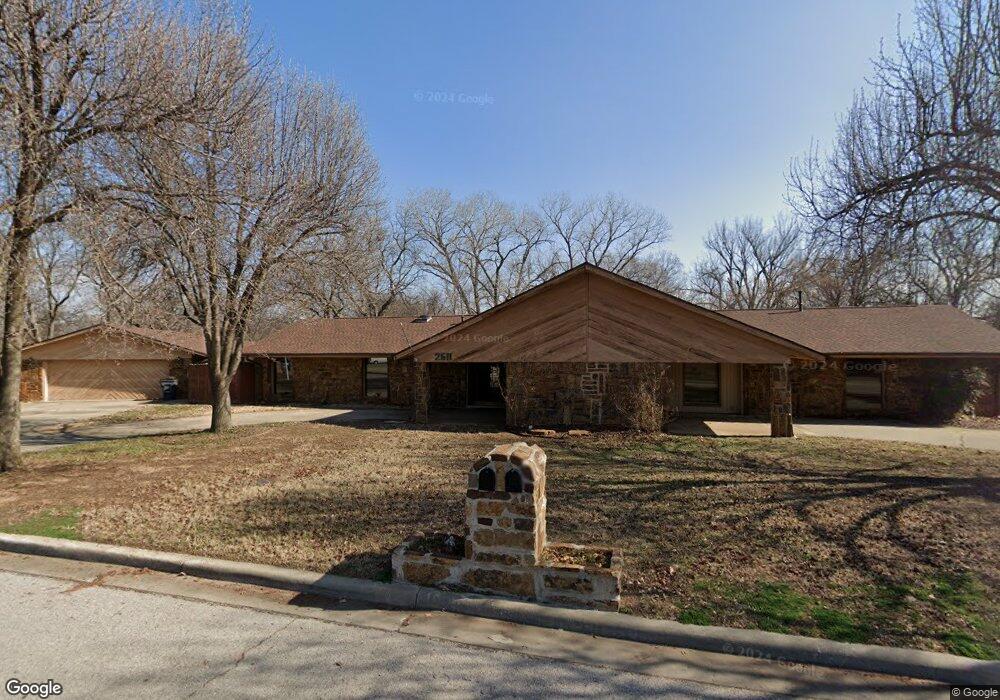
2511 NE Turtle Creek Dr Lawton, OK 73507
Estimated Value: $308,000 - $402,000
6
Beds
4
Baths
3,800
Sq Ft
$97/Sq Ft
Est. Value
About This Home
This home is located at 2511 NE Turtle Creek Dr, Lawton, OK 73507 and is currently estimated at $367,167, approximately $96 per square foot. 2511 NE Turtle Creek Dr is a home located in Comanche County with nearby schools including Pioneer Park Elementary School, MacArthur Middle School, and MacArthur High School.
Ownership History
Date
Name
Owned For
Owner Type
Purchase Details
Closed on
Sep 12, 2018
Sold by
Riordan Thomas and Riordan Sossity
Bought by
Holmes Shauki
Current Estimated Value
Home Financials for this Owner
Home Financials are based on the most recent Mortgage that was taken out on this home.
Original Mortgage
$280,000
Outstanding Balance
$243,700
Interest Rate
4.6%
Mortgage Type
VA
Estimated Equity
$123,467
Purchase Details
Closed on
Feb 15, 2012
Sold by
Mahoney Jeffrey T and Mahoney Shellina R
Bought by
Riordan Thomas and Riordan Sossity
Home Financials for this Owner
Home Financials are based on the most recent Mortgage that was taken out on this home.
Original Mortgage
$183,200
Interest Rate
3.95%
Mortgage Type
New Conventional
Purchase Details
Closed on
Feb 13, 1998
Sold by
Wallace Russell W
Purchase Details
Closed on
Jun 4, 1996
Sold by
Gonzales Jinnie M
Create a Home Valuation Report for This Property
The Home Valuation Report is an in-depth analysis detailing your home's value as well as a comparison with similar homes in the area
Home Values in the Area
Average Home Value in this Area
Purchase History
| Date | Buyer | Sale Price | Title Company |
|---|---|---|---|
| Holmes Shauki | $280,000 | Okf Title Services Llc | |
| Riordan Thomas | $229,000 | Community Escrow & Title Co | |
| -- | $186,000 | -- | |
| -- | $120,000 | -- |
Source: Public Records
Mortgage History
| Date | Status | Borrower | Loan Amount |
|---|---|---|---|
| Open | Holmes Shauki | $280,000 | |
| Previous Owner | Riordan Thomas | $183,200 |
Source: Public Records
Tax History Compared to Growth
Tax History
| Year | Tax Paid | Tax Assessment Tax Assessment Total Assessment is a certain percentage of the fair market value that is determined by local assessors to be the total taxable value of land and additions on the property. | Land | Improvement |
|---|---|---|---|---|
| 2025 | -- | $34,787 | $5,944 | $28,843 |
| 2024 | -- | $34,787 | $5,920 | $28,867 |
| 2023 | $0 | $32,790 | $5,625 | $27,165 |
| 2022 | $0 | $31,835 | $5,625 | $26,210 |
| 2021 | $0 | $31,894 | $5,625 | $26,269 |
| 2020 | $0 | $30,965 | $5,625 | $25,340 |
| 2019 | $2,719 | $30,965 | $5,625 | $25,340 |
| 2018 | $2,719 | $27,308 | $4,832 | $22,476 |
| 2017 | $2,226 | $26,008 | $4,616 | $21,392 |
| 2016 | $2,178 | $24,769 | $4,410 | $20,359 |
| 2015 | $2,214 | $24,769 | $4,410 | $20,359 |
| 2014 | $2,193 | $24,769 | $4,410 | $20,359 |
Source: Public Records
Map
Nearby Homes
- 2604 NE Garden Ln
- 908 NE Dove Ln
- 2501 NE Garden Village
- 907 NE Tortoise Dr
- 2905 NE Tortoise Dr
- 1004 NE Bob White Rd
- 803 NE Turtle Dove Ln
- 0 NE Rogers Ln
- 125 NE Cimarron Trail
- 111 NE English St
- 109 NE English St
- 204 NW Mockingbird Rd
- 2313 NW 4th St
- 418 NW Glendale Dr
- 428 NW Greenmeadow Dr
- 2507 NE Heritage Creek Dr
- 513 NW Mission Blvd
- 605 NW Glendale Dr
- 2527 NE Heritage Creek Dr
- 3002 NE Kingsbriar Dr
- 2507 NE Turtle Creek Dr
- 2513 NE Turtle Creek Dr
- 2510 NE Turtle Creek Dr
- 2506 NE Turtle Creek Dr
- 2508 NE Turtle Creek Dr
- 2505 NE Turtle Creek Dr
- 2512 NE Turtle Creek Dr
- 2515 NE Turtle Creek Dr
- 2504 NE Turtle Creek Dr
- 2517 NE Turtle Creek Dr
- 916 NE Pheasant Ln
- 2503 NE Turtle Creek Dr
- 2514 NE Turtle Creek Dr
- 2502 NE Turtle Creek Dr
- 918 NE Pheasant Ln
- 914 NE Pheasant Ln
- 2501 NE Turtle Creek Dr
- 2525 NE Turtle Creek Dr
- 2516 NE Turtle Creek Dr
- 2519 NE Turtle Creek Dr