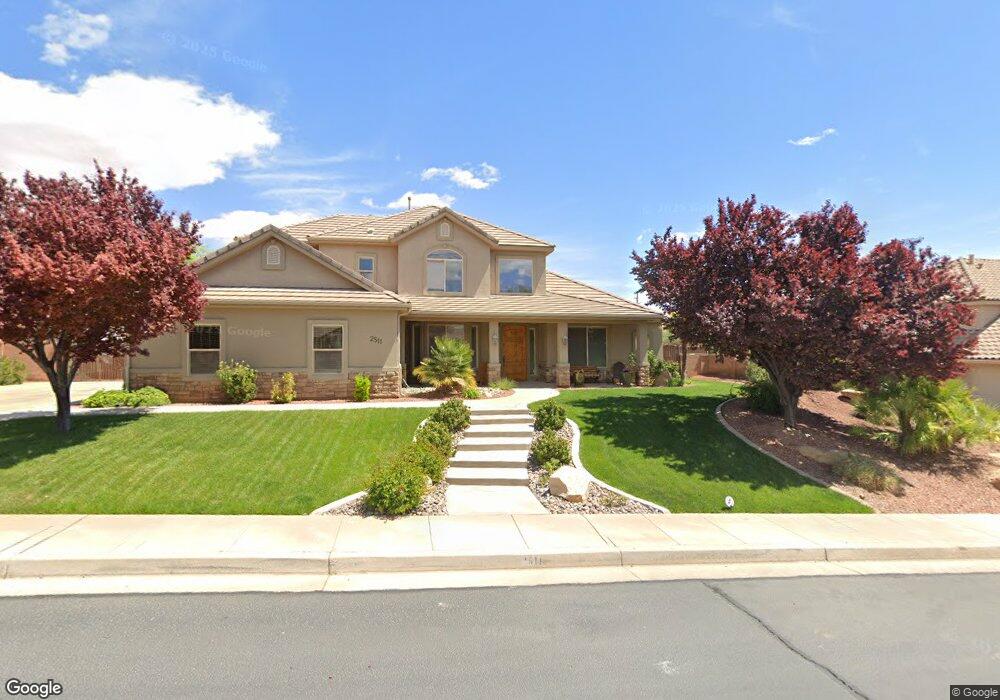
2511 S 2070 East Cir Saint George, UT 84790
Estimated Value: $747,000 - $799,000
5
Beds
4
Baths
3,168
Sq Ft
$242/Sq Ft
Est. Value
About This Home
This home is located at 2511 S 2070 East Cir, Saint George, UT 84790 and is currently estimated at $767,026, approximately $242 per square foot. 2511 S 2070 East Cir is a home located in Washington County with nearby schools including Crimson View Elementary School, Sunrise Ridge Intermediate School, and Desert Hills Middle School.
Ownership History
Date
Name
Owned For
Owner Type
Purchase Details
Closed on
Jan 10, 2019
Sold by
Watts Nicholas K and Watts Wilda W
Bought by
Watts Nicholas K and Watts Wilda W
Current Estimated Value
Purchase Details
Closed on
Nov 9, 2018
Sold by
Hall Joshua C and Hall Sherrie
Bought by
Watts Nicholas K and Watts Wilda W
Purchase Details
Closed on
Dec 29, 2017
Sold by
Morris Jolyn
Bought by
Hall Joshua C and Hall Sherrie
Home Financials for this Owner
Home Financials are based on the most recent Mortgage that was taken out on this home.
Original Mortgage
$413,250
Interest Rate
3.95%
Mortgage Type
New Conventional
Purchase Details
Closed on
Dec 28, 2017
Sold by
Morris Darin
Bought by
Hall Joshua C and Hall Sherrie
Home Financials for this Owner
Home Financials are based on the most recent Mortgage that was taken out on this home.
Original Mortgage
$413,250
Interest Rate
3.95%
Mortgage Type
New Conventional
Create a Home Valuation Report for This Property
The Home Valuation Report is an in-depth analysis detailing your home's value as well as a comparison with similar homes in the area
Home Values in the Area
Average Home Value in this Area
Purchase History
| Date | Buyer | Sale Price | Title Company |
|---|---|---|---|
| Watts Nicholas K | -- | Gt Title | |
| Watts Nicholas K | -- | Gt Title Services | |
| Hall Joshua C | -- | Eagle Gate Title Ins Agency | |
| Hall Joshua C | -- | Eagle Gate Title Ins Agency |
Source: Public Records
Mortgage History
| Date | Status | Borrower | Loan Amount |
|---|---|---|---|
| Previous Owner | Hall Joshua C | $413,250 |
Source: Public Records
Tax History Compared to Growth
Tax History
| Year | Tax Paid | Tax Assessment Tax Assessment Total Assessment is a certain percentage of the fair market value that is determined by local assessors to be the total taxable value of land and additions on the property. | Land | Improvement |
|---|---|---|---|---|
| 2025 | $2,702 | $402,930 | $110,000 | $292,930 |
| 2023 | $2,804 | $418,880 | $93,500 | $325,380 |
| 2022 | $2,876 | $404,140 | $79,750 | $324,390 |
| 2021 | $2,532 | $530,600 | $125,000 | $405,600 |
| 2020 | $2,280 | $449,900 | $105,000 | $344,900 |
| 2019 | $2,283 | $440,200 | $105,000 | $335,200 |
| 2018 | $2,263 | $225,225 | $0 | $0 |
| 2017 | $2,198 | $212,465 | $0 | $0 |
| 2016 | $2,235 | $199,760 | $0 | $0 |
| 2015 | $2,247 | $192,665 | $0 | $0 |
| 2014 | $2,217 | $191,290 | $0 | $0 |
Source: Public Records
Map
Nearby Homes
- 2553 S 2070 E
- 2553 S 2070 E
- 2208 E 2480 S
- 2294 S 2100 E
- 2247 E Coyote Springs Dr
- 2278 S 2100 E
- 3229 S 2150 E
- 2248 E Yant Dr
- 1 Tagan's Way Unit 1
- 3155 S Hidden Dr W Unit 219
- 3125 E 2220 S
- 2839 E Horseman Dr
- 1816 E Boulder Mountain Rd S
- 2789 E Silstone Dr
- 845 Desert Color Lot 845 Phase 8
- 2262 S 2100 E
- 2206 E 2800 S
- 2441 E Meadow Mist Way
- 2391 E 2220 S
- 2031 E Pinnacle Dr
- 2511 S 2070 E
- 2508 S 2110 East Cir
- 2493 S 2070 East Cir
- 2493 S 2070 E
- 2529 S 2070 East Cir
- 2529 S 2070 East Cir
- 2529 S 2070 E
- 2490 S 2110 East Cir
- 2510 S 2070 East Cir
- 2510 S 2070 E
- 2490 S 2110 E
- 2526 S 2110 East Cir
- 2101 E 2540 S
- 2526 E 2110 S
- 2492 S 2070 East Cir
- 2528 S 2070 East Cir
- 2528 S 2070 E
- 2475 S 2070 East Cir
- 2475 S 2070 E
- 2507 S 2010 E