
Seller's Agent in 2025
Noah Bogeart
EXP Realty LLC
(816) 674-9909
40 Total Sales
Estimated Value: $148,000 - $173,000
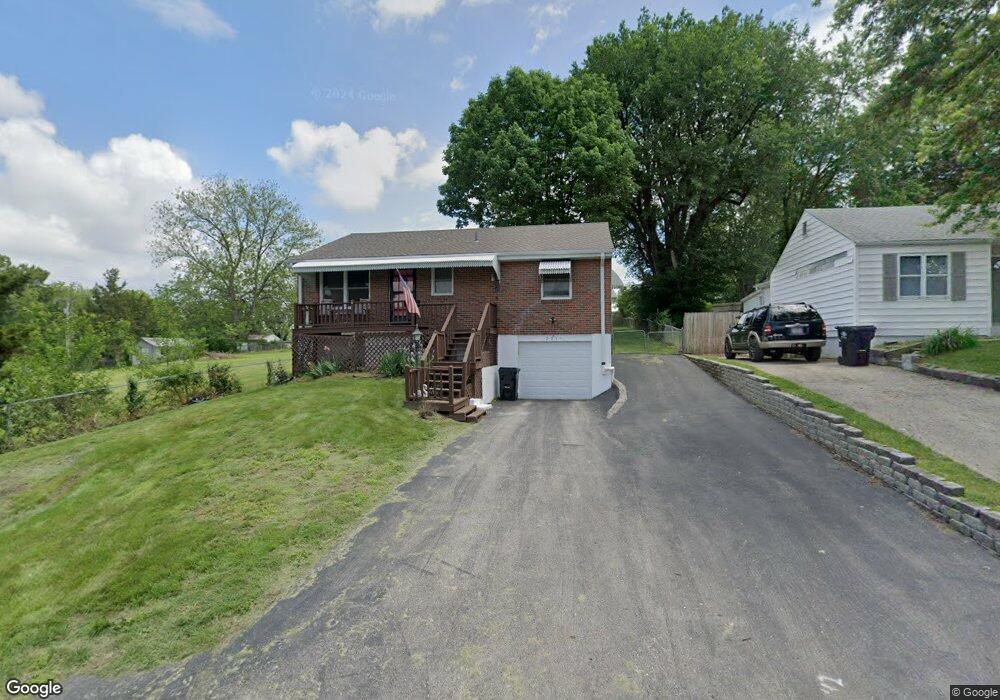
Welcome to your new home in the heart of Independence This Charming 3 Bedroom, 1.5- bath home offers beautiful wood floors that flow throughout the main living areas. Enjoy a spacious, light-filled layout with plenty of room to entertain. Step outside to a large covered deck overlooking the expansive backyard- perfect for gatherings, play, or simply relaxing outdoors. The home also features a newer roof for added peace of mind. Conveniently located near schools, parks and shopping, this property blends comfort, functionality, and value. Don't miss your chance to make it yours!
| Date | Buyer | Sale Price | Title Company |
|---|---|---|---|
| Missouri Real Estate Exchange Llc | -- | Stewart Title Company | |
| Mccomas Kitty L | -- | -- | |
| Mccomas Kitty L | -- | First American Title Ins | |
| Mccomas Kitty Lou | -- | -- | |
| Mccomas Donald L | -- | -- |
| Date | Status | Borrower | Loan Amount |
|---|---|---|---|
| Closed | Missouri Real Estate Exchange Llc | $12,609 |
| Date | Event | Price | List to Sale | Price per Sq Ft |
|---|---|---|---|---|
| 10/31/2025 10/31/25 | For Sale | $189,000 | -- | $181 / Sq Ft |
| Year | Tax Paid | Tax Assessment Tax Assessment Total Assessment is a certain percentage of the fair market value that is determined by local assessors to be the total taxable value of land and additions on the property. | Land | Improvement |
|---|---|---|---|---|
| 2025 | $1,052 | $14,322 | $5,246 | $9,076 |
| 2024 | $1,026 | $14,750 | $1,767 | $12,983 |
| 2023 | $1,026 | $14,749 | $3,241 | $11,508 |
| 2022 | $825 | $10,830 | $1,799 | $9,031 |
| 2021 | $822 | $10,830 | $1,799 | $9,031 |
| 2020 | $803 | $10,307 | $1,799 | $8,508 |
| 2019 | $791 | $10,307 | $1,799 | $8,508 |
| 2018 | $709 | $8,970 | $1,566 | $7,404 |
| 2017 | $709 | $8,970 | $1,566 | $7,404 |
| 2016 | $633 | $7,828 | $1,761 | $6,067 |
| 2014 | $602 | $7,600 | $1,710 | $5,890 |
Seller's Agent in 2025
Noah Bogeart
EXP Realty LLC
(816) 674-9909
40 Total Sales
Seller Co-Listing Agent in 2025
Shelby Lopez
EXP Realty LLC
(816) 678-9677
73 Total Sales