2511 Simon Rd Huntertown, IN 46748
Estimated Value: $300,000 - $315,000
3
Beds
2
Baths
1,696
Sq Ft
$181/Sq Ft
Est. Value
About This Home
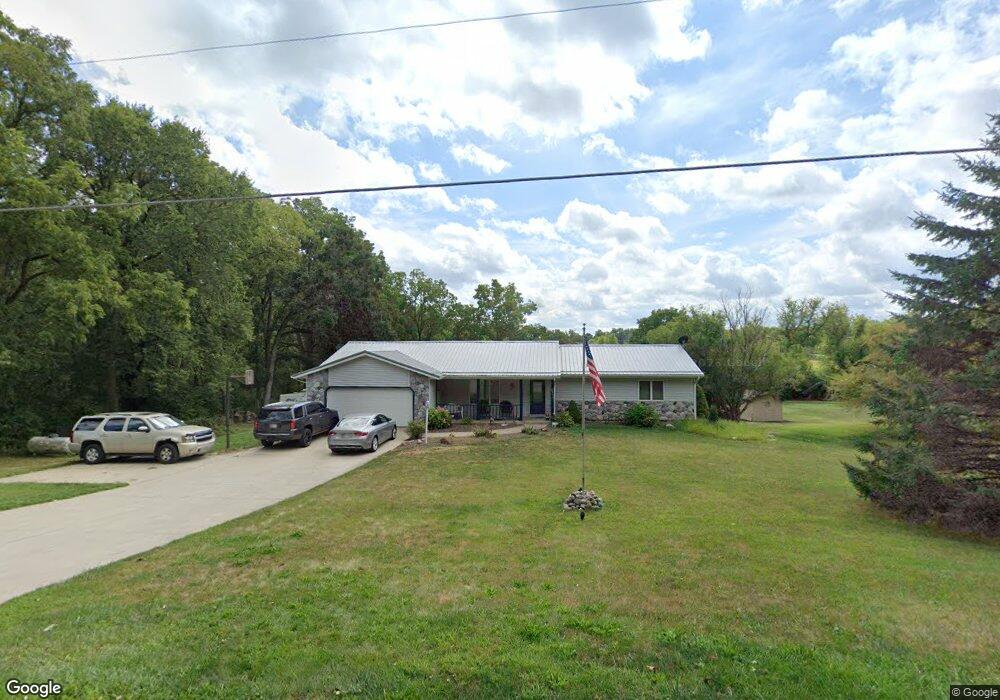
This home is located at 2511 Simon Rd, Huntertown, IN 46748 and is currently estimated at $306,246, approximately $180 per square foot. 2511 Simon Rd is a home located in Allen County with nearby schools including Huntertown Elementary School, Carroll Middle School, and Carroll High School.
Ownership History
Date
Name
Owned For
Owner Type
Purchase Details
Closed on
May 7, 2020
Sold by
Fuhrman Jason T and Fuhrman Dawn C
Bought by
Fuhrman Jason
Current Estimated Value
Purchase Details
Closed on
Jul 2, 2015
Sold by
Ewers David R and Ewers Cheryl A
Bought by
Fuhrman Jason T and Fuhrman Dawn C
Home Financials for this Owner
Home Financials are based on the most recent Mortgage that was taken out on this home.
Original Mortgage
$195,700
Interest Rate
3.86%
Mortgage Type
New Conventional
Create a Home Valuation Report for This Property
The Home Valuation Report is an in-depth analysis detailing your home's value as well as a comparison with similar homes in the area
Purchase History
| Date | Buyer | Sale Price | Title Company |
|---|---|---|---|
| Fuhrman Jason | -- | None Listed On Document | |
| Fuhrman Jason T | -- | Meridian Title Corp |
Source: Public Records
Mortgage History
| Date | Status | Borrower | Loan Amount |
|---|---|---|---|
| Previous Owner | Fuhrman Jason T | $195,700 | |
| Closed | Fuhrman Jason | $0 |
Source: Public Records
Tax History
| Year | Tax Paid | Tax Assessment Tax Assessment Total Assessment is a certain percentage of the fair market value that is determined by local assessors to be the total taxable value of land and additions on the property. | Land | Improvement |
|---|---|---|---|---|
| 2025 | $1,975 | $318,600 | $59,100 | $259,500 |
| 2023 | $1,975 | $268,500 | $59,100 | $209,400 |
| 2022 | $1,613 | $228,100 | $54,800 | $173,300 |
| 2021 | $1,527 | $206,800 | $54,800 | $152,000 |
| 2020 | $1,396 | $188,800 | $54,800 | $134,000 |
| 2019 | $1,293 | $174,400 | $54,800 | $119,600 |
| 2018 | $1,196 | $162,900 | $34,700 | $128,200 |
| 2017 | $1,167 | $154,000 | $34,700 | $119,300 |
| 2016 | $1,201 | $151,800 | $38,500 | $113,300 |
| 2014 | $1,117 | $137,300 | $38,500 | $98,800 |
| 2013 | -- | $133,100 | $38,500 | $94,600 |
Source: Public Records
Map
Nearby Homes
- 17313 Lima Rd
- 17304 Hummelsone Run
- 1910 Portland Cove
- 3219 W Shoaff Rd
- 1575 Farm View Ct
- 1550 Bracht Ct
- 17885 Hutt Ridge Ct
- 17890 Hutt Ridge Ct
- 17330 Fett Dr
- 1523 Pyke Grove Pass
- 1409 Pyke Grove Pass
- 1439 Din Cove
- 1426 Din Cove
- 17839 Monza Pass
- 1397 Dixon Place
- 17155 Carrollton Ct
- 1385 Dixon Place
- 17744 Monza Pass
- 17786 Monza Pass
- 16886 Willow Ridge Trail
Your Personal Tour Guide
Ask me questions while you tour the home.