Estimated Value: $177,000 - $243,000
4
Beds
1
Bath
1,440
Sq Ft
$148/Sq Ft
Est. Value
About This Home
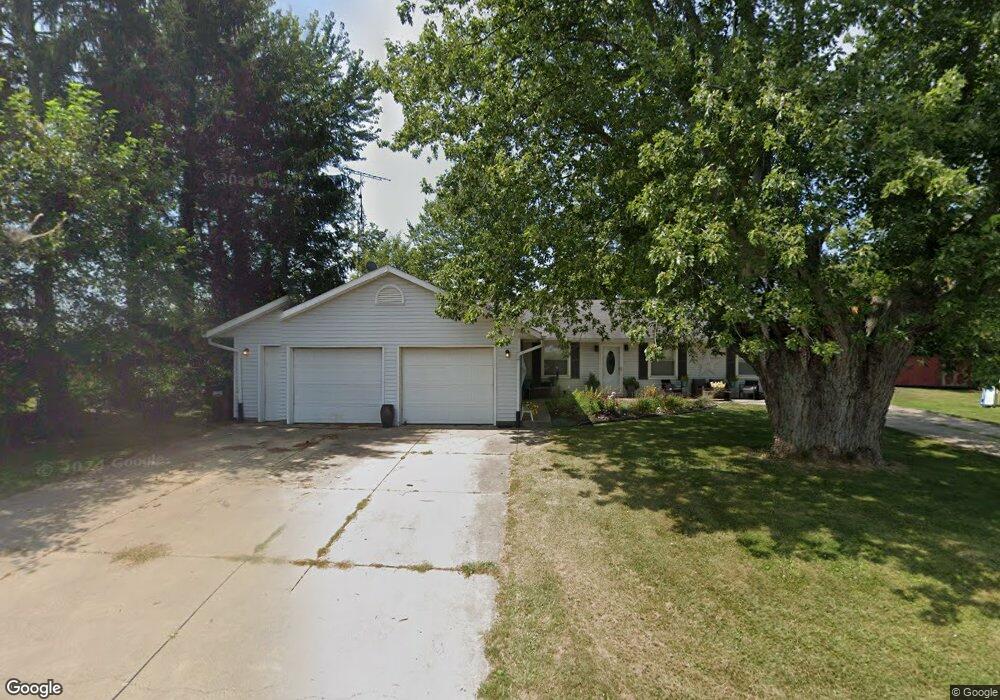
This home is located at 2511 Toby Rd, Eaton, OH 45320 and is currently estimated at $213,673, approximately $148 per square foot. 2511 Toby Rd is a home located in Preble County with nearby schools including National Trail Elementary School, National Trail Middle School, and National Trail High School.
Ownership History
Date
Name
Owned For
Owner Type
Purchase Details
Closed on
Aug 17, 2021
Sold by
Webb Joseph B and Webb Jana L
Bought by
Rike Scott
Current Estimated Value
Home Financials for this Owner
Home Financials are based on the most recent Mortgage that was taken out on this home.
Original Mortgage
$141,320
Outstanding Balance
$126,683
Interest Rate
2.7%
Mortgage Type
FHA
Estimated Equity
$86,990
Purchase Details
Closed on
Dec 17, 2007
Sold by
Chase Home Finance Llc
Bought by
Webb Joseph B and Webb Jana L
Purchase Details
Closed on
Aug 28, 2007
Sold by
Stewart Melvin and Stewart Pamela
Bought by
Chase Home Finance Llc
Purchase Details
Closed on
Dec 12, 2000
Sold by
Newman James
Bought by
Stewart Melvin and Stewart Pamela
Home Financials for this Owner
Home Financials are based on the most recent Mortgage that was taken out on this home.
Original Mortgage
$99,500
Interest Rate
7.7%
Mortgage Type
New Conventional
Create a Home Valuation Report for This Property
The Home Valuation Report is an in-depth analysis detailing your home's value as well as a comparison with similar homes in the area
Purchase History
| Date | Buyer | Sale Price | Title Company |
|---|---|---|---|
| Rike Scott | $144,500 | None Available | |
| Webb Joseph B | $74,000 | Freedom Title Company Inc | |
| Chase Home Finance Llc | -- | Allddial Title Inc | |
| Stewart Melvin | $93,500 | -- |
Source: Public Records
Mortgage History
| Date | Status | Borrower | Loan Amount |
|---|---|---|---|
| Open | Rike Scott | $141,320 | |
| Previous Owner | Stewart Melvin | $99,500 |
Source: Public Records
Tax History
| Year | Tax Paid | Tax Assessment Tax Assessment Total Assessment is a certain percentage of the fair market value that is determined by local assessors to be the total taxable value of land and additions on the property. | Land | Improvement |
|---|---|---|---|---|
| 2025 | $1,541 | $46,690 | $5,740 | $40,950 |
| 2024 | $1,541 | $46,690 | $5,740 | $40,950 |
| 2023 | $1,563 | $46,690 | $5,740 | $40,950 |
| 2022 | $1,112 | $29,580 | $5,180 | $24,400 |
| 2021 | $1,175 | $29,580 | $5,180 | $24,400 |
| 2020 | $1,122 | $29,580 | $5,180 | $24,400 |
| 2019 | $979 | $26,260 | $4,450 | $21,810 |
| 2018 | $1,016 | $26,260 | $4,450 | $21,810 |
| 2017 | $956 | $26,260 | $4,450 | $21,810 |
| 2016 | $802 | $21,990 | $4,310 | $17,680 |
| 2014 | $1,228 | $21,990 | $4,310 | $17,680 |
| 2013 | $1,555 | $26,705 | $4,305 | $22,400 |
Source: Public Records
Map
Nearby Homes
- 3127 Upshur Northern Rd
- 1262 Surface Rd
- 0 & 00 Washington Jackson Rd
- 1016 Alexander Rd
- 0 Washington Jackson Rd Unit 1516310
- 6007 Murray Rd
- 509 Golden Crossing
- 922 W Main St
- 519 Romadoor Ave Unit 520
- 413 Golden Crossing Unit 512
- 1747 N Barron St
- 108 Connie Cir
- 109 Martha Ct
- 104 Martha Ct
- 108 Arlington Dr
- 200 Arlington Dr
- 301 Arlington Dr
- 709 N Barron St Unit 711
- 108 Calvert Ct
- 124 Deem St
- 2387 Toby Rd
- 2387 Toby Rd
- 2231 Toby Rd
- 2805 Toby Rd
- 4372 Us Route 35
- 4468 Us Route 35
- 4426 Us Route 35
- 4391 Us Route 35
- 4322 Cemetary Rd
- 4277 Conley Rd
- 4798 35 Us W
- 4798 Us Route 35
- 2041 Toby Rd
- 4810 Us Route 35 W
- 4822 Us Route 35
- 4334 Cemetary Rd
- 4870 Us Route 35
- 4062 Us Route 35
- 4062 Us Route 35
- 4957 Cemetary Rd
Your Personal Tour Guide
Ask me questions while you tour the home.