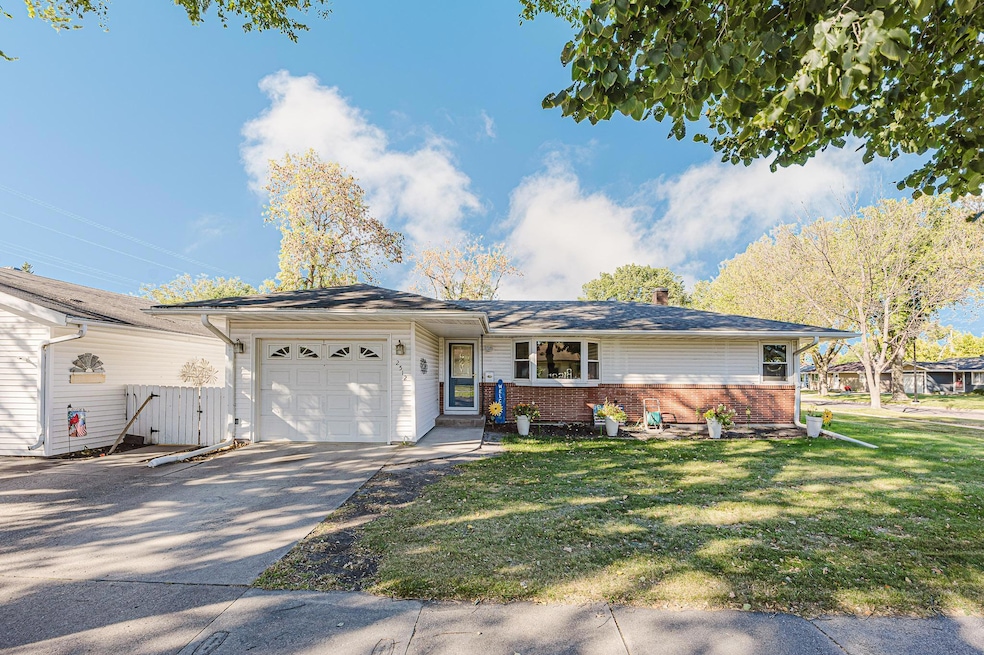
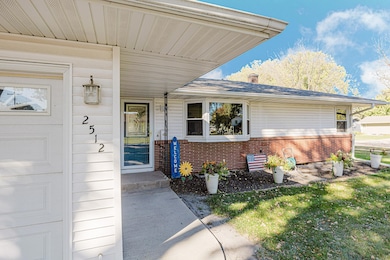
2512 2nd St N Fargo, ND 58102
Northport NeighborhoodEstimated payment $1,664/month
Highlights
- Bonus Room
- No HOA
- Living Room
- Longfellow Elementary School Rated A
- 3 Car Attached Garage
- 5-minute walk to Friendship Park
About This Home
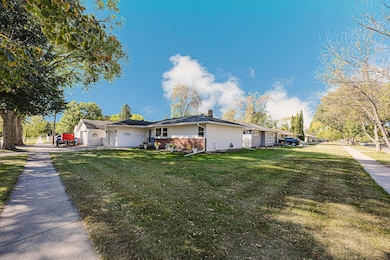
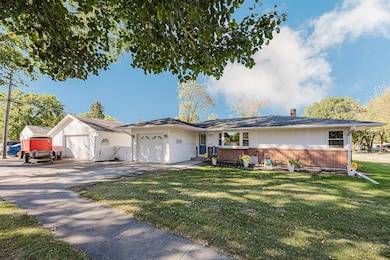
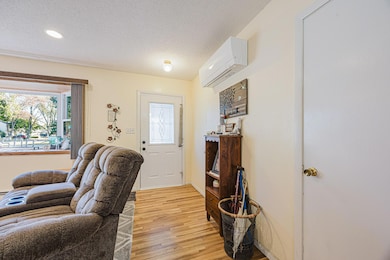
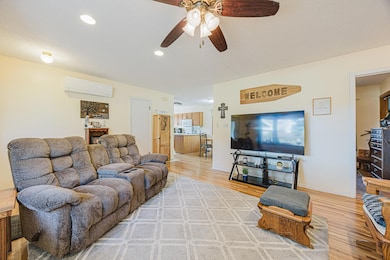
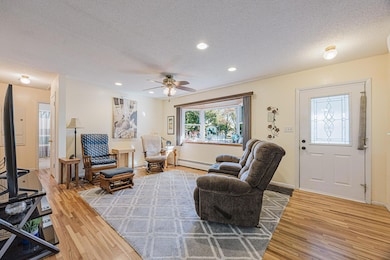
3 STALL CORNER LOT! RECENT ADDITION OF HOME WARRANTY PROGRAM FOR ADDED PEACE OF MIND FOR POTENTIAL BUYERS! Nestled on a spacious corner lot surrounded by mature trees and just steps from a quiet park, this 4-bedroom, 2-bath rambler is a true gem. The home features beautiful oak floors throughout and an open-concept main level with a bright living area, dining space, and kitchen. The primary suite offers a walk-in closet, accompanied by two additional bedrooms and a full bath on the main floor. The lower level includes a massive fourth bedroom, family room, bonus area, and an additional bathroom—perfect for guests or extra living space. Enjoy plenty of parking and storage with both an attached single stall garage and a detached 24x28 oversized double stall. A rare combination of location, space, and character—this North Fargo home is one you won’t want to miss!
Listing Agent
eXp Realty (3240 WF) Brokerage Phone: 701-361-8738 Listed on: 10/10/2025

Home Details
Home Type
- Single Family
Est. Annual Taxes
- $2,920
Year Built
- Built in 1957
Lot Details
- 7,057 Sq Ft Lot
- Lot Dimensions are 116 x 61
Parking
- 3 Car Attached Garage
Home Design
- Vinyl Siding
Interior Spaces
- 1-Story Property
- Family Room
- Living Room
- Dining Room
- Bonus Room
- Utility Room
- Basement
Bedrooms and Bathrooms
- 4 Bedrooms
Utilities
- Mini Split Air Conditioners
- Baseboard Heating
Community Details
- No Home Owners Association
- Oral A Holm Subdivision
Listing and Financial Details
- Assessor Parcel Number 01138000380000
Map
Home Values in the Area
Average Home Value in this Area
Tax History
| Year | Tax Paid | Tax Assessment Tax Assessment Total Assessment is a certain percentage of the fair market value that is determined by local assessors to be the total taxable value of land and additions on the property. | Land | Improvement |
|---|---|---|---|---|
| 2024 | $2,920 | $115,800 | $28,100 | $87,700 |
| 2023 | $3,229 | $109,250 | $28,100 | $81,150 |
| 2022 | $3,109 | $103,050 | $28,100 | $74,950 |
| 2021 | $2,826 | $100,050 | $28,100 | $71,950 |
| 2020 | $2,619 | $93,500 | $28,100 | $65,400 |
| 2019 | $2,461 | $93,500 | $15,600 | $77,900 |
| 2018 | $2,618 | $100,800 | $15,600 | $85,200 |
| 2017 | $2,705 | $97,850 | $15,600 | $82,250 |
| 2016 | $2,279 | $88,950 | $15,600 | $73,350 |
| 2015 | $2,222 | $80,850 | $11,700 | $69,150 |
| 2014 | $2,126 | $74,850 | $11,700 | $63,150 |
| 2013 | $2,043 | $71,300 | $11,700 | $59,600 |
Property History
| Date | Event | Price | List to Sale | Price per Sq Ft |
|---|---|---|---|---|
| 11/12/2025 11/12/25 | Price Changed | $270,000 | -3.6% | $134 / Sq Ft |
| 10/17/2025 10/17/25 | Price Changed | $280,000 | -5.1% | $139 / Sq Ft |
| 10/10/2025 10/10/25 | For Sale | $295,000 | -- | $146 / Sq Ft |
Purchase History
| Date | Type | Sale Price | Title Company |
|---|---|---|---|
| Warranty Deed | $210,000 | Northern Title Co | |
| Warranty Deed | $150,000 | Title Co | |
| Warranty Deed | -- | -- |
Mortgage History
| Date | Status | Loan Amount | Loan Type |
|---|---|---|---|
| Open | $215,040 | VA | |
| Previous Owner | $110,800 | New Conventional |
Source: NorthstarMLS
MLS Number: 6801838
APN: 01-1380-00380-000
Disclaimer: Certain information contained herein is derived from information provided by parties other than Homes.com. All information provided is deemed reliable, but is not guaranteed to be accurate and should be independently verified.
![]() Based on information submitted to the MLS GRID. All data is obtained from various sources and may not have been verified by broker or MLS GRID. Supplied Open House Information is subject to change without notice. All information should be independently reviewed and verified for accuracy. Properties may or may not be listed by the office/agent presenting the information. Some IDX listings have been excluded from this website.
Based on information submitted to the MLS GRID. All data is obtained from various sources and may not have been verified by broker or MLS GRID. Supplied Open House Information is subject to change without notice. All information should be independently reviewed and verified for accuracy. Properties may or may not be listed by the office/agent presenting the information. Some IDX listings have been excluded from this website.
The Digital Millennium Copyright Act of 1998, 17 U.S.C. § 512 (the “DMCA”) provides recourse for copyright owners who believe that material appearing on the Internet infringes their rights under U.S. copyright law. If you believe in good faith that any content or material made available in connection with our website or services infringes your copyright, you (or your agent) may send us a notice requesting that the content or material be removed, or access to it blocked.
Notices must be sent in writing by email to DMCAnotice@MLSGrid.com.
The DMCA requires that your notice of alleged copyright infringement include the following information:
(1) description of the copyrighted work that is the subject of claimed infringement;
(2) description of the alleged infringing content and information sufficient to permit us to locate the content;
(3) contact information for you, including your address, telephone number and email address;
(4) a statement by you that you have a good faith belief that the content in the manner complained of is not authorized by the copyright owner, or its agent, or by the operation of any law;
(5) a statement by you, signed under penalty of perjury, that the information in the notification is accurate and that you have the authority to enforce the copyrights that are claimed to be infringed; and
(6) a physical or electronic signature of the copyright owner or a person authorized to act on the copyright owner’s behalf. Failure to include all of the above information may result in the delay of the processing of your complaint.
- 2702 2nd St N
- 101 27th Ave N
- 207 23rd Ave N
- 310 27th Ave N
- 2807 Edgewood Dr N
- 87 28th Ave N
- 418 25th Ave N
- 2510 Evergreen Rd N
- 2902 3rd St N
- 501 Forest Ave N Unit C
- 111 19th Ave N
- 305 19th Ave N
- 2926 Edgewood Dr N
- 2925 Edgewood Dr N
- 1822 3rd St N
- 2937 Edgewood Dr N
- 314 18th Ave N
- 2214 9 1 2 St N
- 2878 Lilac Ln N
- 1914 9th St N
- 517 28th Ave N
- 3105 Broadway N
- 3202 Broadway N
- 3301-3315 N Broadway Dr
- 1919 University Dr N
- 201 35th Ave N
- 3402 Par St N
- 1151 32nd Ave N
- 1601 University Dr N
- 1342 Broadway N
- 1310 Broadway N
- 1302 9th St N
- 1146 9th St N
- 714 11th Ave N
- 814 11th Ave N
- 1113 University Dr N
- 1224 11th Ave N
- 1224 11th Ave N
- 620 9th Ave
- 1221 10th Ave N Unit 2