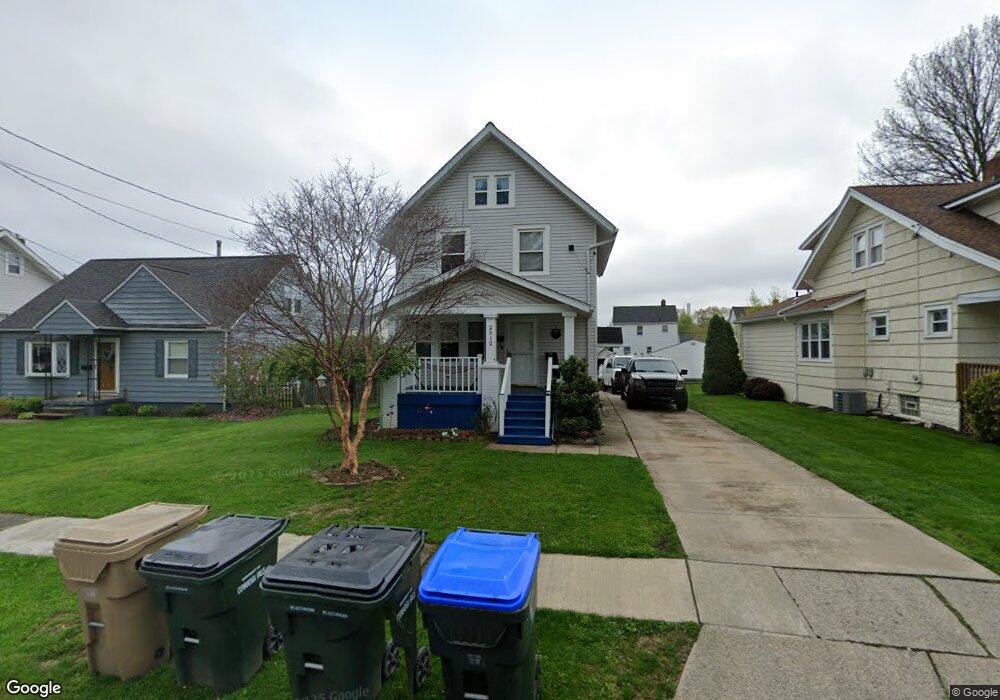
2512 7th St Cuyahoga Falls, OH 44221
Mud Brook NeighborhoodEstimated Value: $188,421 - $215,000
3
Beds
1
Bath
1,248
Sq Ft
$163/Sq Ft
Est. Value
About This Home
This home is located at 2512 7th St, Cuyahoga Falls, OH 44221 and is currently estimated at $203,855, approximately $163 per square foot. 2512 7th St is a home located in Summit County with nearby schools including Dewitt Elementary School, Bolich Middle School, and Cuyahoga Falls High School.
Ownership History
Date
Name
Owned For
Owner Type
Purchase Details
Closed on
Mar 31, 2019
Sold by
Paolucci James and Paolucci Stephanie
Bought by
Moreno William Antonio and De Moreno Rosa Carolina Ramirez
Current Estimated Value
Home Financials for this Owner
Home Financials are based on the most recent Mortgage that was taken out on this home.
Original Mortgage
$101,700
Outstanding Balance
$89,412
Interest Rate
4.3%
Mortgage Type
New Conventional
Estimated Equity
$114,443
Purchase Details
Closed on
Dec 1, 2012
Sold by
Paolucci James and Paolucci Stephanie
Bought by
Paolucci Stephanie and Paolucci James
Purchase Details
Closed on
Sep 30, 2002
Sold by
Cochran Katherine M and Cochran Katherine M
Bought by
Paolucci James
Home Financials for this Owner
Home Financials are based on the most recent Mortgage that was taken out on this home.
Original Mortgage
$111,746
Interest Rate
6.34%
Mortgage Type
FHA
Create a Home Valuation Report for This Property
The Home Valuation Report is an in-depth analysis detailing your home's value as well as a comparison with similar homes in the area
Home Values in the Area
Average Home Value in this Area
Purchase History
| Date | Buyer | Sale Price | Title Company |
|---|---|---|---|
| Moreno William Antonio | $113,000 | Landmark Title Group Llc | |
| Paolucci Stephanie | -- | None Available | |
| Paolucci James | $113,500 | Wigley Title |
Source: Public Records
Mortgage History
| Date | Status | Borrower | Loan Amount |
|---|---|---|---|
| Open | Moreno William Antonio | $101,700 | |
| Previous Owner | Paolucci James | $111,746 |
Source: Public Records
Tax History Compared to Growth
Tax History
| Year | Tax Paid | Tax Assessment Tax Assessment Total Assessment is a certain percentage of the fair market value that is determined by local assessors to be the total taxable value of land and additions on the property. | Land | Improvement |
|---|---|---|---|---|
| 2025 | $3,096 | $54,251 | $10,581 | $43,670 |
| 2024 | $3,096 | $54,251 | $10,581 | $43,670 |
| 2023 | $3,096 | $54,251 | $10,581 | $43,670 |
| 2022 | $2,887 | $41,013 | $7,896 | $33,117 |
| 2021 | $2,787 | $41,013 | $7,896 | $33,117 |
| 2020 | $2,842 | $41,020 | $7,900 | $33,120 |
| 2019 | $2,554 | $34,810 | $7,900 | $26,910 |
| 2018 | $2,313 | $34,810 | $7,900 | $26,910 |
| 2017 | $1,889 | $34,810 | $7,900 | $26,910 |
| 2016 | $1,891 | $31,400 | $7,900 | $23,500 |
| 2015 | $1,889 | $31,400 | $7,900 | $23,500 |
| 2014 | $1,890 | $31,400 | $7,900 | $23,500 |
| 2013 | $1,997 | $33,480 | $7,900 | $25,580 |
Source: Public Records
Map
Nearby Homes