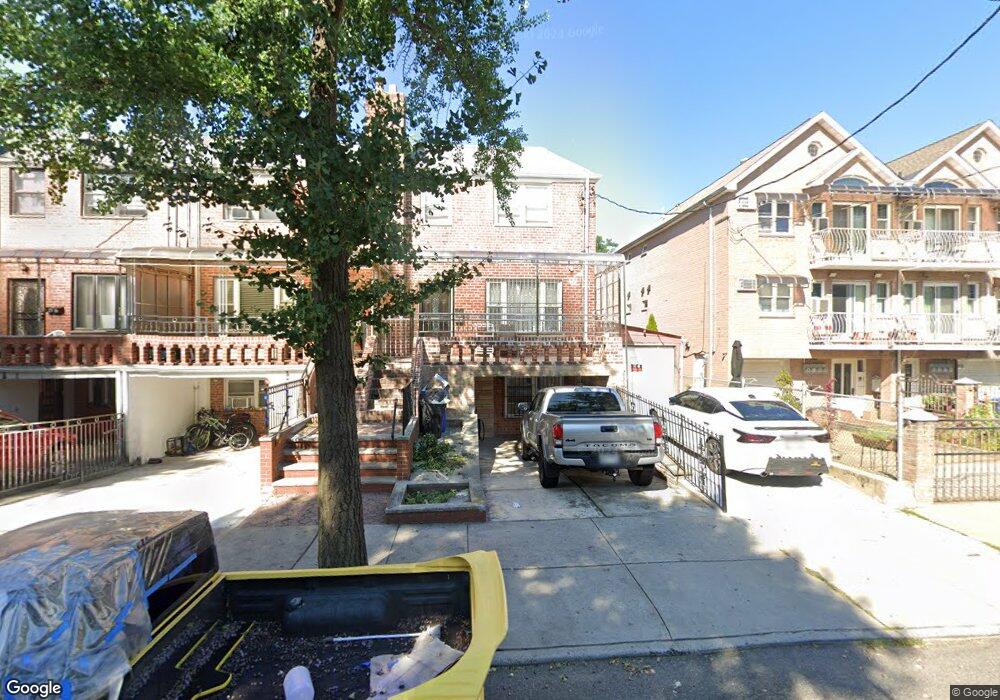
2512 88th St East Elmhurst, NY 11369
Jackson Heights NeighborhoodEstimated Value: $1,007,000 - $1,065,000
--
Bed
--
Bath
1,480
Sq Ft
$697/Sq Ft
Est. Value
About This Home
This home is located at 2512 88th St, East Elmhurst, NY 11369 and is currently estimated at $1,031,370, approximately $696 per square foot. 2512 88th St is a home located in Queens County with nearby schools including P.S. 148, I.S. 145 Joseph Pulitzer Magnet School, and Newtown High School.
Ownership History
Date
Name
Owned For
Owner Type
Purchase Details
Closed on
Aug 30, 2023
Sold by
Estate Of Astrid Arteaga and Maria Ryan As Executor
Bought by
Lu Yun and Wang Wen Pu
Current Estimated Value
Home Financials for this Owner
Home Financials are based on the most recent Mortgage that was taken out on this home.
Original Mortgage
$648,700
Outstanding Balance
$634,942
Interest Rate
6.96%
Mortgage Type
Purchase Money Mortgage
Estimated Equity
$396,428
Purchase Details
Closed on
Sep 25, 1999
Sold by
Arteaga Astrid and Arteaga Naizly
Bought by
Arteaga Astrid
Create a Home Valuation Report for This Property
The Home Valuation Report is an in-depth analysis detailing your home's value as well as a comparison with similar homes in the area
Home Values in the Area
Average Home Value in this Area
Purchase History
| Date | Buyer | Sale Price | Title Company |
|---|---|---|---|
| Lu Yun | $998,000 | -- | |
| Lu Yun | $998,000 | -- | |
| Arteaga Astrid | -- | -- | |
| Arteaga Astrid | -- | -- |
Source: Public Records
Mortgage History
| Date | Status | Borrower | Loan Amount |
|---|---|---|---|
| Open | Lu Yun | $648,700 | |
| Closed | Lu Yun | $648,700 |
Source: Public Records
Tax History Compared to Growth
Tax History
| Year | Tax Paid | Tax Assessment Tax Assessment Total Assessment is a certain percentage of the fair market value that is determined by local assessors to be the total taxable value of land and additions on the property. | Land | Improvement |
|---|---|---|---|---|
| 2025 | $8,436 | $44,519 | $8,262 | $36,257 |
| 2024 | $8,436 | $42,001 | $8,264 | $33,737 |
| 2023 | $8,076 | $40,210 | $8,741 | $31,469 |
| 2022 | $6,945 | $49,320 | $10,200 | $39,120 |
| 2021 | $7,617 | $51,000 | $10,200 | $40,800 |
| 2020 | $7,194 | $45,780 | $10,200 | $35,580 |
| 2019 | $6,663 | $50,400 | $10,200 | $40,200 |
| 2018 | $6,172 | $33,508 | $6,913 | $26,595 |
| 2017 | $6,185 | $33,508 | $8,818 | $24,690 |
| 2016 | $5,930 | $33,508 | $8,818 | $24,690 |
| 2015 | $3,374 | $30,916 | $8,681 | $22,235 |
| 2014 | $3,374 | $29,168 | $9,620 | $19,548 |
Source: Public Records
Map
Nearby Homes