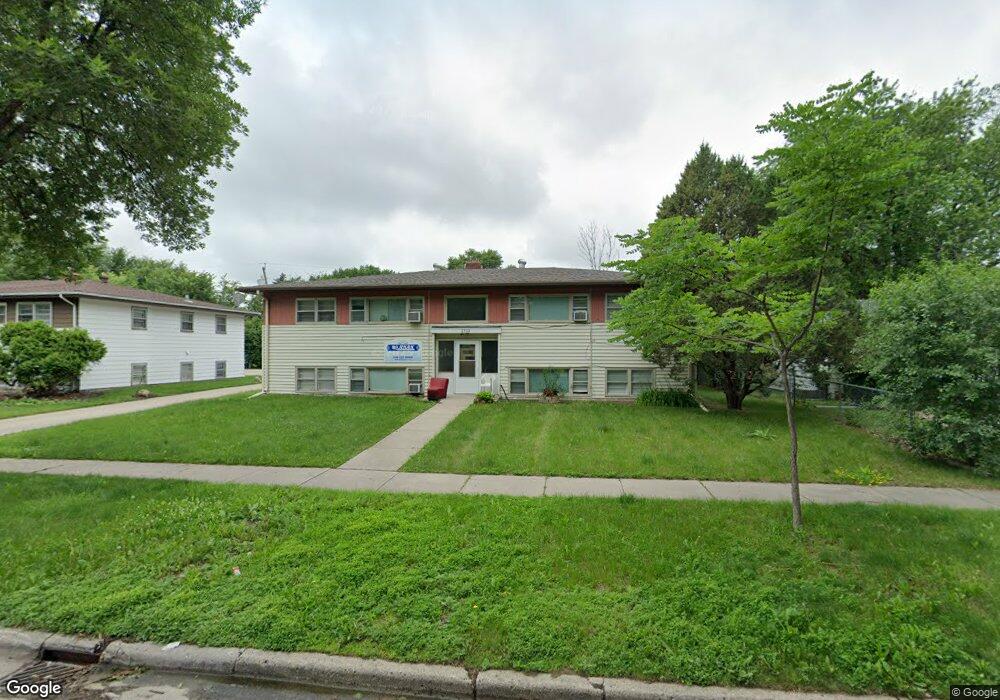
2512 9th St N Unit 4 Fargo, ND 58102
Northport NeighborhoodEstimated Value: $273,000 - $317,000
--
Bed
--
Bath
3,672
Sq Ft
$82/Sq Ft
Est. Value
About This Home
This home is located at 2512 9th St N Unit 4, Fargo, ND 58102 and is currently estimated at $300,711, approximately $81 per square foot. 2512 9th St N Unit 4 is a home located in Cass County with nearby schools including McKinley Elementary School, Ben Franklin Middle School, and North High School.
Ownership History
Date
Name
Owned For
Owner Type
Purchase Details
Closed on
Sep 24, 2018
Sold by
First In Real Estate Llc
Bought by
Jw Properties Group Llc
Current Estimated Value
Purchase Details
Closed on
Jun 13, 2013
Sold by
Limevere Jean Kay and Estate Of Karl Limvere
Bought by
First In Real Estate Llc
Home Financials for this Owner
Home Financials are based on the most recent Mortgage that was taken out on this home.
Original Mortgage
$121,600
Interest Rate
3.52%
Mortgage Type
Commercial
Create a Home Valuation Report for This Property
The Home Valuation Report is an in-depth analysis detailing your home's value as well as a comparison with similar homes in the area
Home Values in the Area
Average Home Value in this Area
Purchase History
| Date | Buyer | Sale Price | Title Company |
|---|---|---|---|
| Jw Properties Group Llc | -- | All American Title | |
| First In Real Estate Llc | $152,000 | Valley Title & Escrow |
Source: Public Records
Mortgage History
| Date | Status | Borrower | Loan Amount |
|---|---|---|---|
| Previous Owner | First In Real Estate Llc | $121,600 |
Source: Public Records
Tax History Compared to Growth
Tax History
| Year | Tax Paid | Tax Assessment Tax Assessment Total Assessment is a certain percentage of the fair market value that is determined by local assessors to be the total taxable value of land and additions on the property. | Land | Improvement |
|---|---|---|---|---|
| 2024 | $4,848 | $151,250 | $16,500 | $134,750 |
| 2023 | $4,417 | $137,500 | $16,500 | $121,000 |
| 2022 | $3,943 | $119,550 | $16,500 | $103,050 |
| 2021 | $3,556 | $108,700 | $16,500 | $92,200 |
| 2020 | $3,211 | $104,500 | $16,500 | $88,000 |
| 2019 | $3,056 | $104,500 | $11,500 | $93,000 |
| 2018 | $3,016 | $104,500 | $11,500 | $93,000 |
| 2017 | $2,741 | $91,750 | $11,500 | $80,250 |
| 2016 | $2,697 | $91,750 | $9,500 | $82,250 |
| 2015 | $2,776 | $87,400 | $9,500 | $77,900 |
| 2014 | $2,525 | $76,000 | $9,500 | $66,500 |
| 2013 | $985 | $68,750 | $9,500 | $59,250 |
Source: Public Records
Map
Nearby Homes
- 2510 10th St N
- 2214 9 1 2 St N
- 418 25th Ave N
- 310 27th Ave N
- 1914 9th St N
- 501 Forest Ave N Unit C
- 2902 3rd St N
- 2807 Edgewood Dr N
- 2512 2nd St N
- 207 23rd Ave N
- 305 19th Ave N
- 3113 8th St N
- 101 27th Ave N
- 3129 8th St N
- 1822 3rd St N
- 87 28th Ave N
- 314 18th Ave N
- 801 32nd Ave N Unit A102
- 3216 Broadway N
- 2926 Edgewood Dr N