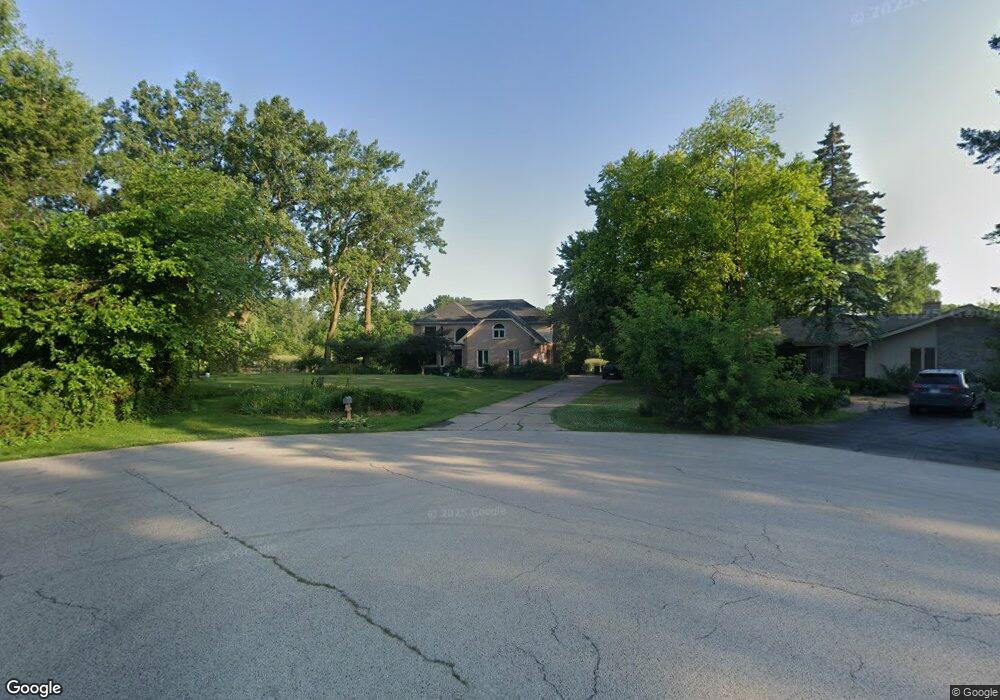
2512 Cavalry Ct Long Grove, IL 60047
Estimated Value: $797,739 - $1,054,000
Studio
3
Baths
3,518
Sq Ft
$264/Sq Ft
Est. Value
About This Home
This home is located at 2512 Cavalry Ct, Long Grove, IL 60047 and is currently estimated at $927,185, approximately $263 per square foot. 2512 Cavalry Ct is a home located in Lake County with nearby schools including Kildeer Countryside Elementary School, Woodlawn Middle School, and Adlai E Stevenson High School.
Ownership History
Date
Name
Owned For
Owner Type
Purchase Details
Closed on
Sep 3, 2010
Sold by
Zhou Henry X
Bought by
Zhou Henry X and Huang Halyan
Current Estimated Value
Purchase Details
Closed on
Apr 16, 2010
Sold by
Huang Xiayan and Huang Xiaoyan Lillian
Bought by
Zhou Henry X
Home Financials for this Owner
Home Financials are based on the most recent Mortgage that was taken out on this home.
Original Mortgage
$416,800
Outstanding Balance
$278,290
Interest Rate
5.05%
Mortgage Type
New Conventional
Estimated Equity
$648,895
Purchase Details
Closed on
Aug 16, 2000
Sold by
Semar Christine J and Christine J Semar Revocable Tr
Bought by
Huang Xiaoyan
Home Financials for this Owner
Home Financials are based on the most recent Mortgage that was taken out on this home.
Original Mortgage
$252,700
Interest Rate
8.05%
Purchase Details
Closed on
Dec 18, 1997
Sold by
Semar Christine J
Bought by
Semar Christine J and Christine J Semar Revocable Li
Create a Home Valuation Report for This Property
The Home Valuation Report is an in-depth analysis detailing your home's value as well as a comparison with similar homes in the area
Home Values in the Area
Average Home Value in this Area
Purchase History
| Date | Buyer | Sale Price | Title Company |
|---|---|---|---|
| Zhou Henry X | -- | None Available | |
| Zhou Henry X | -- | None Available | |
| Huang Xiaoyan | $525,000 | -- | |
| Semar Christine J | -- | -- |
Source: Public Records
Mortgage History
| Date | Status | Borrower | Loan Amount |
|---|---|---|---|
| Open | Zhou Henry X | $416,800 | |
| Previous Owner | Huang Xiaoyan | $252,700 |
Source: Public Records
Tax History
| Year | Tax Paid | Tax Assessment Tax Assessment Total Assessment is a certain percentage of the fair market value that is determined by local assessors to be the total taxable value of land and additions on the property. | Land | Improvement |
|---|---|---|---|---|
| 2024 | $17,974 | $195,377 | $34,971 | $160,406 |
| 2023 | $17,796 | $190,130 | $34,032 | $156,098 |
| 2022 | $17,796 | $188,689 | $33,373 | $155,316 |
| 2021 | $16,945 | $183,854 | $32,518 | $151,336 |
| 2020 | $16,510 | $183,854 | $32,518 | $151,336 |
| 2019 | $15,995 | $182,250 | $32,234 | $150,016 |
| 2018 | $15,220 | $179,147 | $34,676 | $144,471 |
| 2017 | $15,035 | $176,988 | $34,258 | $142,730 |
| 2016 | $14,667 | $171,384 | $33,173 | $138,211 |
| 2015 | $14,922 | $166,392 | $28,219 | $138,173 |
| 2014 | $15,720 | $172,481 | $31,723 | $140,758 |
| 2012 | $15,047 | $172,844 | $31,790 | $141,054 |
Source: Public Records
Map
Nearby Homes
- 2507 Lincoln Ave
- 2527 Checker Rd
- 1773 Andrew Ct
- 2413 Randall Ln Unit 3B
- 2243 W Nichols Rd Unit 31B
- 854 E Carriage Ln Unit 8
- 2176 N Westmoreland Dr
- 2198 N Oakbrook Cir Unit 2198
- 2186 N Oakbrook Cir Unit 3C
- 823 E Coach Rd Unit 8
- 2245 Nichols Rd Unit C
- 1182 E Barberry Ln Unit A
- 2215 Nichols Rd Unit 21C
- 3459 W Mardan Dr
- 1240 Antietam Dr
- 4131 N Pheasant Trail Ct Unit 8
- 1408 W Crane St Unit 5
- 3523 Long Grove Rd
- 3273 Merrimac Ln
- 1956 N Jamestown Dr Unit 353
- 2510 Cavalry Ct
- 2511 Cavalry Ct
- 2508 Lincoln Ave Unit 2
- 2506 Lincoln Ave Unit 2
- 2514 Lincoln Ave
- 2351 Bayberry Ln
- 2504 Lincoln Ave
- 2355 Bayberry Ln
- 2516 Lincoln Ave
- 2515 Lincoln Ave
- 2509 Lincoln Ave
- 2375 Checker Rd
- 2502 Lincoln Ave
- 2505 Lincoln Ave
- 2518 Lincoln Ave
- 2347 Bayberry Ln
- 2517 Lincoln Ave
- 2438 Federal Ct Unit 2
- 2519 Lincoln Ave Unit 2
Your Personal Tour Guide
Ask me questions while you tour the home.