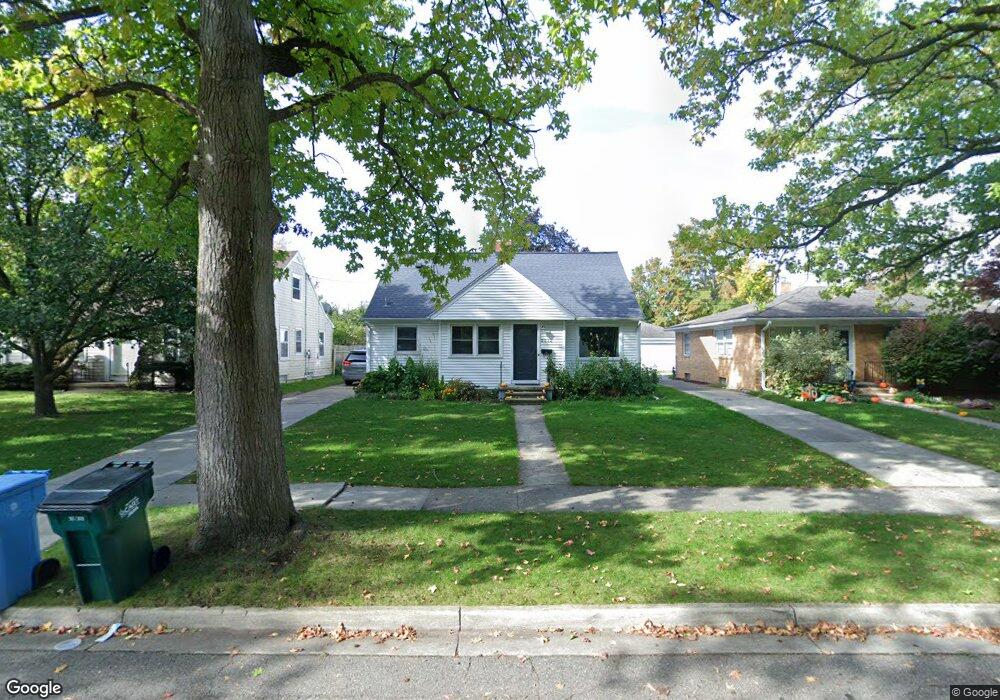
2512 Concord Rd Lansing, MI 48910
Colonial Village NeighborhoodEstimated Value: $165,236 - $200,000
Studio
--
Bath
1,281
Sq Ft
$143/Sq Ft
Est. Value
About This Home
This home is located at 2512 Concord Rd, Lansing, MI 48910 and is currently estimated at $183,809, approximately $143 per square foot. 2512 Concord Rd is a home located in Ingham County with nearby schools including Averill Elementary School, Attwood School, and J.W. Sexton High School.
Ownership History
Date
Name
Owned For
Owner Type
Purchase Details
Closed on
Jul 28, 2006
Sold by
Przygocki Cathleen
Bought by
Decker Adam and Decker Heidi
Current Estimated Value
Home Financials for this Owner
Home Financials are based on the most recent Mortgage that was taken out on this home.
Original Mortgage
$125,400
Outstanding Balance
$75,656
Interest Rate
6.85%
Mortgage Type
Purchase Money Mortgage
Estimated Equity
$108,153
Purchase Details
Closed on
Mar 31, 2003
Sold by
Busch Andrew R and Busch Jennifer M
Bought by
Przygocki Cathleen
Home Financials for this Owner
Home Financials are based on the most recent Mortgage that was taken out on this home.
Original Mortgage
$108,000
Interest Rate
5.86%
Mortgage Type
Purchase Money Mortgage
Purchase Details
Closed on
Nov 4, 1997
Sold by
Campbell Eloise
Bought by
Busch Andrew R and Busch Jennifer
Create a Home Valuation Report for This Property
The Home Valuation Report is an in-depth analysis detailing your home's value as well as a comparison with similar homes in the area
Home Values in the Area
Average Home Value in this Area
Purchase History
| Date | Buyer | Sale Price | Title Company |
|---|---|---|---|
| Decker Adam | $132,000 | None Available | |
| Przygocki Cathleen | $135,000 | Midstate Title Co | |
| Busch Andrew R | $85,300 | -- |
Source: Public Records
Mortgage History
| Date | Status | Borrower | Loan Amount |
|---|---|---|---|
| Open | Decker Adam | $125,400 | |
| Previous Owner | Przygocki Cathleen | $108,000 | |
| Closed | Przygocki Cathleen | $20,250 |
Source: Public Records
Tax History
| Year | Tax Paid | Tax Assessment Tax Assessment Total Assessment is a certain percentage of the fair market value that is determined by local assessors to be the total taxable value of land and additions on the property. | Land | Improvement |
|---|---|---|---|---|
| 2025 | $3,197 | $83,000 | $9,000 | $74,000 |
| 2024 | $25 | $76,400 | $9,000 | $67,400 |
| 2023 | $2,997 | $69,100 | $9,000 | $60,100 |
| 2022 | $2,701 | $62,500 | $7,400 | $55,100 |
| 2021 | $2,645 | $58,300 | $5,900 | $52,400 |
| 2020 | $2,629 | $56,300 | $5,900 | $50,400 |
| 2019 | $2,520 | $50,800 | $5,900 | $44,900 |
| 2018 | $2,362 | $47,600 | $5,900 | $41,700 |
| 2017 | $2,261 | $47,600 | $5,900 | $41,700 |
| 2016 | $2,162 | $42,200 | $5,900 | $36,300 |
| 2015 | $2,162 | $39,200 | $11,874 | $27,326 |
| 2014 | $2,162 | $38,800 | $8,906 | $29,894 |
Source: Public Records
Map
Nearby Homes
- 2505 Fairfax Rd
- 1618 Loraine Ave
- 1703 Holly Way
- 2105 Hampden Dr
- 2409 Victor Ave
- 1926 Peggy St
- 2315 Belaire Dr
- 2016 Pattengill Ave
- 2408 Dunlap St
- 2519 Belaire Dr
- 1740 Wellington Rd Unit 207
- 1740 Wellington Rd Unit 103
- 1312 W Mount Hope Ave
- 1315 Goodrich St
- 2924 Woodview Dr
- 2001 S Martin Luther King Junior Blvd
- 1533 Cambridge Rd
- 1114 Goodrich St
- 1116 George St
- 924 Loa St
- 2516 Concord Rd
- 2506 Concord Rd
- 2500 Concord Rd
- 2520 Concord Rd
- 2511 Chatham Rd
- 1934 Loraine Ave
- 2517 Chatham Rd
- 2505 Chatham Rd
- 2420 Concord Rd
- 2509 Concord Rd
- 2521 Chatham Rd
- 2515 Concord Rd
- 2505 Concord Rd
- 2501 Chatham Rd
- 2501 Concord Rd
- 2519 Concord Rd
- 2416 Concord Rd
- 2419 Concord Rd
- 2417 Chatham Rd
- 1908 Loraine Ave
Your Personal Tour Guide
Ask me questions while you tour the home.