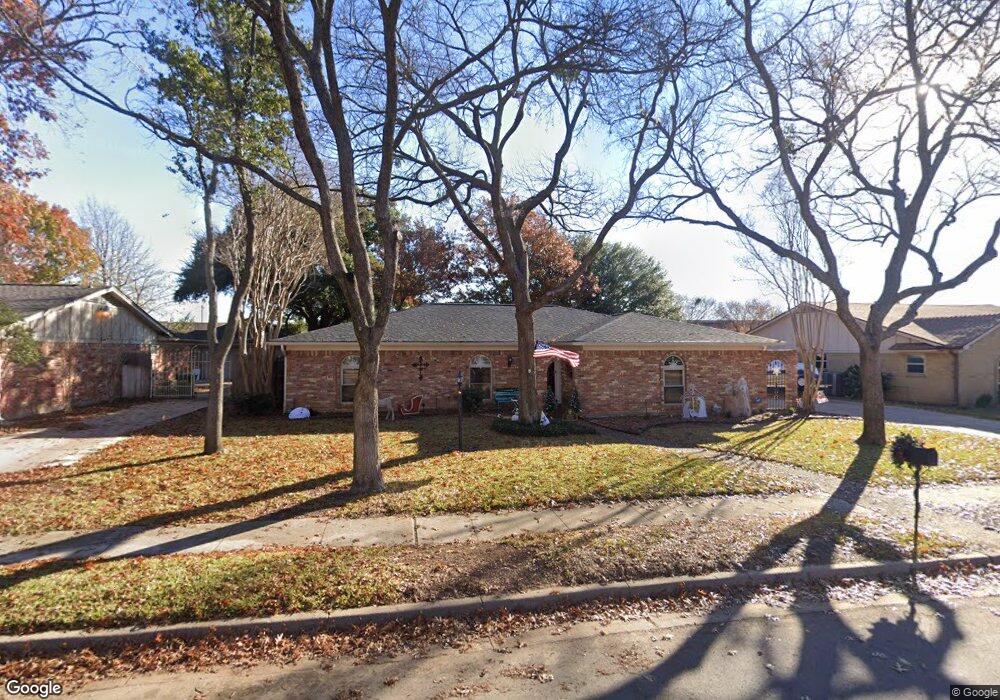
2512 Lakeview Dr Bedford, TX 76021
Estimated Value: $330,906 - $367,000
3
Beds
2
Baths
1,603
Sq Ft
$220/Sq Ft
Est. Value
About This Home
This home is located at 2512 Lakeview Dr, Bedford, TX 76021 and is currently estimated at $352,227, approximately $219 per square foot. 2512 Lakeview Dr is a home located in Tarrant County with nearby schools including Shady Brook Elementary School, Bedford Junior High School, and L.D. Bell High School.
Ownership History
Date
Name
Owned For
Owner Type
Purchase Details
Closed on
Feb 9, 2015
Sold by
Rhom Steven and Rhom Sarah
Bought by
Brown Douglas Avery and Brown Deborah K
Current Estimated Value
Home Financials for this Owner
Home Financials are based on the most recent Mortgage that was taken out on this home.
Original Mortgage
$126,562
Outstanding Balance
$97,506
Interest Rate
3.92%
Mortgage Type
VA
Estimated Equity
$254,721
Purchase Details
Closed on
Sep 15, 2005
Sold by
Rhom Douglas Carl and Rhom Tracey E
Bought by
Marsh Mary Colette
Home Financials for this Owner
Home Financials are based on the most recent Mortgage that was taken out on this home.
Original Mortgage
$106,000
Interest Rate
5.88%
Mortgage Type
Fannie Mae Freddie Mac
Create a Home Valuation Report for This Property
The Home Valuation Report is an in-depth analysis detailing your home's value as well as a comparison with similar homes in the area
Home Values in the Area
Average Home Value in this Area
Purchase History
| Date | Buyer | Sale Price | Title Company |
|---|---|---|---|
| Brown Douglas Avery | -- | Multiple | |
| Marsh Mary Colette | -- | -- |
Source: Public Records
Mortgage History
| Date | Status | Borrower | Loan Amount |
|---|---|---|---|
| Open | Brown Douglas Avery | $126,562 | |
| Previous Owner | Marsh Mary Colette | $106,000 |
Source: Public Records
Tax History Compared to Growth
Tax History
| Year | Tax Paid | Tax Assessment Tax Assessment Total Assessment is a certain percentage of the fair market value that is determined by local assessors to be the total taxable value of land and additions on the property. | Land | Improvement |
|---|---|---|---|---|
| 2025 | $1,454 | $256,106 | $80,000 | $176,106 |
| 2024 | $1,454 | $256,106 | $80,000 | $176,106 |
| 2023 | $4,205 | $219,246 | $80,000 | $139,246 |
| 2022 | $4,705 | $215,426 | $80,000 | $135,426 |
| 2021 | $4,963 | $210,700 | $80,000 | $130,700 |
| 2020 | $5,284 | $222,243 | $80,000 | $142,243 |
| 2019 | $5,188 | $223,491 | $80,000 | $143,491 |
| 2018 | $2,809 | $194,140 | $80,000 | $114,140 |
| 2017 | $4,270 | $200,740 | $22,000 | $178,740 |
| 2016 | $3,881 | $160,446 | $22,000 | $138,446 |
| 2015 | $3,090 | $134,000 | $22,000 | $112,000 |
| 2014 | $3,090 | $134,000 | $22,000 | $112,000 |
Source: Public Records
Map
Nearby Homes
- 2508 Lakeview Dr
- 2501 Shady Grove Dr
- 2700 Shady Grove Dr
- 2704 Shady Grove Dr
- 2317 Shady Grove Dr
- 1013 Springdale Rd
- 922 Shady Creek Ln
- 2225 Shady Brook Dr
- 1401 Danielle Dr
- 801 Shady Creek Ln
- 2901 Miles Way
- 2420 Stonegate Dr N
- 2524 Shady Ridge Dr
- 2503 Shady Ridge Dr
- 49 Morrow Dr
- 817 Shady Lake Dr
- 31 Morrow Dr
- 1601 Warwickshire Ct W
- 37 Devonshire Dr
- 2436 Brookgreen Ct
- 2516 Lakeview Dr
- 2504 Lakeview Dr
- 2520 Lakeview Dr
- 2513 Lakeview Dr
- 2517 Lakeview Dr
- 2509 Lakeview Dr
- 2521 Lakeview Dr
- 2500 Lakeview Dr
- 2524 Lakeview Dr
- 2525 Lakeview Dr
- 2512 Shady Grove Dr
- 2516 Shady Grove Dr
- 2501 Lakeview Dr
- 2508 Shady Grove Dr
- 2600 Shady Grove Dr
- 2504 Shady Grove Dr
- 2528 Lakeview Dr
- 2604 Shady Grove Dr
- 2529 Lakeview Dr
- 2500 Shady Grove Dr