Estimated Value: $488,046 - $554,000
Studio
3
Baths
2,034
Sq Ft
$260/Sq Ft
Est. Value
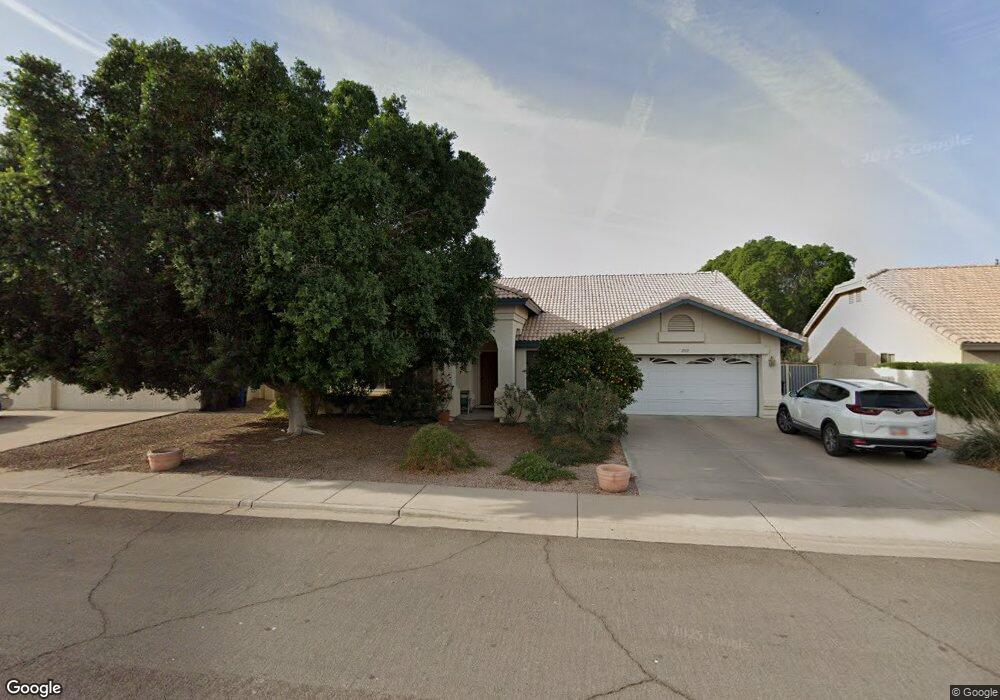
About This Home
This home is located at 2512 N Saffron, Mesa, AZ 85215 and is currently estimated at $528,512, approximately $259 per square foot. 2512 N Saffron is a home located in Maricopa County with nearby schools including Red Mountain Ranch Elementary School, Franklin at Brimhall Elementary School, and Franklin West Elementary School.
Ownership History
Date
Name
Owned For
Owner Type
Purchase Details
Closed on
Sep 12, 2002
Sold by
Gustafson Allan R and Gustafson Jackie
Bought by
Atkins A Leroy and Atkins Mary M
Current Estimated Value
Purchase Details
Closed on
Aug 11, 1995
Sold by
Lennar Homes Of Arizona Inc
Bought by
Gustafson Allan R and Gustafson Jackie
Home Financials for this Owner
Home Financials are based on the most recent Mortgage that was taken out on this home.
Original Mortgage
$117,600
Interest Rate
7.63%
Mortgage Type
New Conventional
Purchase Details
Closed on
Aug 1, 1995
Sold by
Lennar Communities Development Inc
Bought by
Lennar Homes Of Arizona Inc
Home Financials for this Owner
Home Financials are based on the most recent Mortgage that was taken out on this home.
Original Mortgage
$117,600
Interest Rate
7.63%
Mortgage Type
New Conventional
Purchase Details
Closed on
Dec 14, 1994
Sold by
Broad Land Properties Inc
Bought by
Lennar Communities Development Inc
Create a Home Valuation Report for This Property
The Home Valuation Report is an in-depth analysis detailing your home's value as well as a comparison with similar homes in the area
Purchase History
| Date | Buyer | Sale Price | Title Company |
|---|---|---|---|
| Atkins A Leroy | $205,000 | Transnation Title Insurance | |
| Gustafson Allan R | $150,622 | First Southwestern Title | |
| Lennar Homes Of Arizona Inc | -- | First Southwestern Title | |
| Lennar Communities Development Inc | $122,500 | Old Republic Title Agency |
Source: Public Records
Mortgage History
| Date | Status | Borrower | Loan Amount |
|---|---|---|---|
| Previous Owner | Gustafson Allan R | $117,600 |
Source: Public Records
Tax History
| Year | Tax Paid | Tax Assessment Tax Assessment Total Assessment is a certain percentage of the fair market value that is determined by local assessors to be the total taxable value of land and additions on the property. | Land | Improvement |
|---|---|---|---|---|
| 2025 | $2,449 | $29,481 | -- | -- |
| 2024 | $2,475 | $28,077 | -- | -- |
| 2023 | $2,475 | $41,510 | $8,300 | $33,210 |
| 2022 | $2,421 | $30,880 | $6,170 | $24,710 |
| 2021 | $2,487 | $29,410 | $5,880 | $23,530 |
| 2020 | $2,454 | $27,260 | $5,450 | $21,810 |
| 2019 | $2,273 | $25,400 | $5,080 | $20,320 |
| 2018 | $2,170 | $24,270 | $4,850 | $19,420 |
| 2017 | $2,102 | $22,970 | $4,590 | $18,380 |
| 2016 | $2,064 | $22,620 | $4,520 | $18,100 |
| 2015 | $1,949 | $22,410 | $4,480 | $17,930 |
Source: Public Records
Map
Nearby Homes
- 2634 N Saffron Cir
- 6563 E Northridge St
- 2656 N Ricardo Unit 4
- 6730 E Hermosa Vista Dr Unit 53
- 6749 E Norwood St
- 6708 E Northridge St
- 6760 E Northridge St
- 6764 E Northridge St
- 2607 N Platina Cir
- 2602 N Platina Cir
- 6452 E Omega St
- 6515 E Holiday Dr
- 2202 N 63rd Place
- 2132 N 63rd Place
- 7031 E Mallory St
- 2633 N 61st St
- 2329 N Recker Rd Unit 20
- 2329 N Recker Rd Unit 16
- 6456 E Orion St
- 2636 N 61st St
- 2506 N Saffron
- 2518 N Saffron
- 2466 N Saffron
- 2524 N Saffron
- 2511 N Saffron
- 2519 N Saffron
- 2505 N Saffron
- 2532 N Saffron
- 2460 N Saffron
- 2525 N Saffron
- 2461 N Saffron
- 2454 N Saffron
- 2533 N Saffron Unit 2
- 2453 N Saffron
- 6561 E Melrose St
- 6553 E Melrose St
- 2448 N Saffron
- 6545 E Melrose St
- 2541 N Saffron
- 2445 N Saffron
Your Personal Tour Guide
Ask me questions while you tour the home.