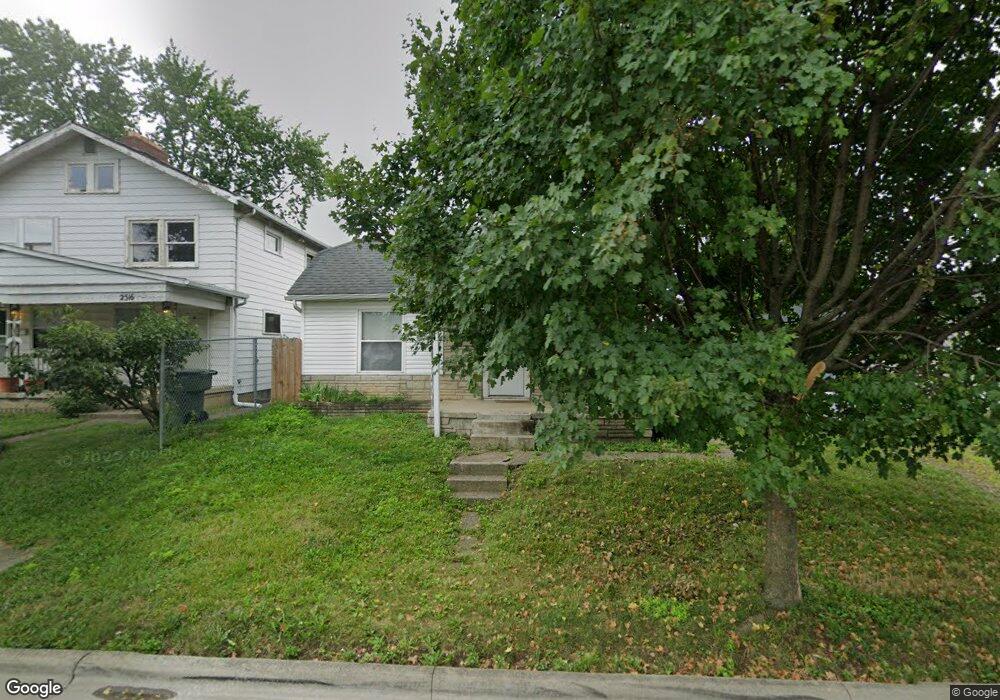
2512 Osceola Ave Columbus, OH 43211
North Linden NeighborhoodEstimated Value: $109,508 - $152,000
2
Beds
1
Bath
754
Sq Ft
$171/Sq Ft
Est. Value
About This Home
This home is located at 2512 Osceola Ave, Columbus, OH 43211 and is currently estimated at $129,127, approximately $171 per square foot. 2512 Osceola Ave is a home located in Franklin County with nearby schools including Como Elementary School, Dominion Middle School, and Whetstone High School.
Ownership History
Date
Name
Owned For
Owner Type
Purchase Details
Closed on
Sep 17, 2021
Sold by
Harris Tisha M
Bought by
Tax Ease Ohio Ii Llc
Current Estimated Value
Purchase Details
Closed on
Jun 8, 2004
Sold by
Ostrander Robert
Bought by
Harris Tisha M
Home Financials for this Owner
Home Financials are based on the most recent Mortgage that was taken out on this home.
Original Mortgage
$71,250
Interest Rate
8.12%
Mortgage Type
Purchase Money Mortgage
Purchase Details
Closed on
Jul 23, 1998
Sold by
Mccracken Christopher
Bought by
Ostrander Robert
Home Financials for this Owner
Home Financials are based on the most recent Mortgage that was taken out on this home.
Original Mortgage
$58,650
Interest Rate
7.13%
Purchase Details
Closed on
Mar 24, 1997
Sold by
Mathews Chuck
Bought by
Mccracken Chris
Purchase Details
Closed on
Feb 17, 1989
Create a Home Valuation Report for This Property
The Home Valuation Report is an in-depth analysis detailing your home's value as well as a comparison with similar homes in the area
Home Values in the Area
Average Home Value in this Area
Purchase History
| Date | Buyer | Sale Price | Title Company |
|---|---|---|---|
| Tax Ease Ohio Ii Llc | $1,054 | None Listed On Document | |
| Harris Tisha M | $75,000 | Worldclass Title Agency Llc | |
| Ostrander Robert | $69,000 | Peterson Title Agency | |
| Mccracken Chris | $32,000 | -- | |
| -- | $9,000 | -- |
Source: Public Records
Mortgage History
| Date | Status | Borrower | Loan Amount |
|---|---|---|---|
| Previous Owner | Harris Tisha M | $71,250 | |
| Previous Owner | Ostrander Robert | $58,650 | |
| Closed | Mccracken Chris | $0 |
Source: Public Records
Tax History
| Year | Tax Paid | Tax Assessment Tax Assessment Total Assessment is a certain percentage of the fair market value that is determined by local assessors to be the total taxable value of land and additions on the property. | Land | Improvement |
|---|---|---|---|---|
| 2025 | $3,874 | $31,370 | $9,140 | $22,230 |
| 2024 | $3,874 | $31,370 | $9,140 | $22,230 |
| 2023 | $1,390 | $31,360 | $9,135 | $22,225 |
| 2022 | $1,603 | $15,060 | $4,800 | $10,260 |
| 2021 | $782 | $15,060 | $4,800 | $10,260 |
| 2020 | $783 | $15,060 | $4,800 | $10,260 |
| 2019 | $758 | $12,500 | $4,170 | $8,330 |
| 2018 | $743 | $12,500 | $4,170 | $8,330 |
| 2017 | $780 | $12,500 | $4,170 | $8,330 |
| 2016 | $803 | $12,120 | $3,470 | $8,650 |
| 2015 | $729 | $12,120 | $3,470 | $8,650 |
| 2014 | $731 | $12,120 | $3,470 | $8,650 |
| 2013 | $424 | $14,245 | $4,095 | $10,150 |
Source: Public Records
Map
Nearby Homes
- 2560 Osceola Ave
- 2593 Osceola Ave
- 2569 Audubon Rd
- 2459 Atwood Terrace
- 2593 Atwood Terrace
- 954 E Hudson St
- 2352 Hiawatha Park Dr
- 2610 Atwood Terrace
- 2295 Velma Ave
- 2288 Hiawatha Park Dr
- 2595 Grasmere Ave
- 2733 Beulah Rd
- 2488 McGuffey Rd
- 525-527 E Tompkins St
- 1084 E Hudson St
- 2311 McGuffey Rd
- 2205 Atwood Terrace
- 2362 McGuffey Rd
- 2539 N 4th St Unit 539
- 2776 Howey Rd
- 2506 Osceola Ave
- 2518 Osceola Ave Unit 516
- 2524 Osceola Ave
- 2500 Osceola Ave Unit 502
- 2496 Osceola Ave
- 2498 Osceola Ave
- 2505 Pontiac St
- 2530 Osceola Ave
- 2499 Pontiac St
- 2515 Pontiac St
- 2515 Pontiac St
- 2490 Osceola Ave
- 2513 Osceola Ave
- 2507 Osceola Ave
- 2534 Osceola Ave Unit 536
- 2534-2536 Osceola Ave
- 2489 Pontiac St
- 2523 Pontiac St
- 2523 Osceola Ave
- 2484 Osceola Ave
Your Personal Tour Guide
Ask me questions while you tour the home.