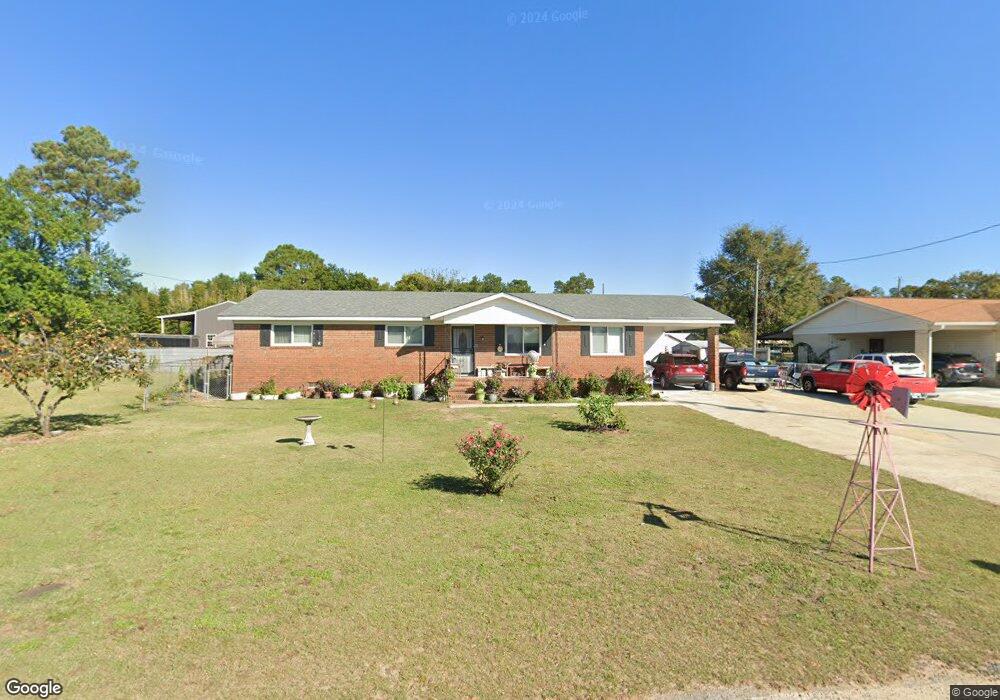
2513 Anthony Dejuan Pkwy Hephzibah, GA 30815
Jamestown NeighborhoodEstimated Value: $131,000 - $198,000
3
Beds
2
Baths
1,640
Sq Ft
$102/Sq Ft
Est. Value
About This Home
This home is located at 2513 Anthony Dejuan Pkwy, Hephzibah, GA 30815 and is currently estimated at $167,855, approximately $102 per square foot. 2513 Anthony Dejuan Pkwy is a home located in Richmond County with nearby schools including Diamond Lakes Elementary School, Pine Hill Middle School, and Johnson Magnet.
Ownership History
Date
Name
Owned For
Owner Type
Purchase Details
Closed on
Feb 28, 2006
Sold by
Household Realty Corp
Bought by
Shipes Allen D
Current Estimated Value
Purchase Details
Closed on
Dec 6, 2005
Sold by
Kelley Ray and Mortgage Electronic Registrati
Bought by
Household Realty Corp
Purchase Details
Closed on
Nov 5, 2003
Sold by
2513 Lincolnton Parkway Trust
Bought by
Kelley Ray
Home Financials for this Owner
Home Financials are based on the most recent Mortgage that was taken out on this home.
Original Mortgage
$85,500
Interest Rate
8.99%
Mortgage Type
Purchase Money Mortgage
Purchase Details
Closed on
Oct 23, 2003
Sold by
Johnson Randall L
Bought by
Topken Peter and 2513 Lincolnton Parkway Trust
Home Financials for this Owner
Home Financials are based on the most recent Mortgage that was taken out on this home.
Original Mortgage
$85,500
Interest Rate
8.99%
Mortgage Type
Purchase Money Mortgage
Purchase Details
Closed on
Nov 22, 1995
Sold by
Lytle Donald M
Bought by
Johnson Randall L
Create a Home Valuation Report for This Property
The Home Valuation Report is an in-depth analysis detailing your home's value as well as a comparison with similar homes in the area
Home Values in the Area
Average Home Value in this Area
Purchase History
| Date | Buyer | Sale Price | Title Company |
|---|---|---|---|
| Shipes Allen D | $70,000 | None Available | |
| Household Realty Corp | $69,832 | None Available | |
| Kelley Ray | $80,000 | -- | |
| Topken Peter | -- | -- | |
| Johnson Randall L | $65,900 | -- |
Source: Public Records
Mortgage History
| Date | Status | Borrower | Loan Amount |
|---|---|---|---|
| Previous Owner | Kelley Ray | $85,500 |
Source: Public Records
Tax History Compared to Growth
Tax History
| Year | Tax Paid | Tax Assessment Tax Assessment Total Assessment is a certain percentage of the fair market value that is determined by local assessors to be the total taxable value of land and additions on the property. | Land | Improvement |
|---|---|---|---|---|
| 2025 | $1,028 | $73,604 | $4,480 | $69,124 |
| 2024 | $1,028 | $60,752 | $4,480 | $56,272 |
| 2023 | $873 | $60,040 | $4,480 | $55,560 |
| 2022 | $883 | $52,041 | $4,480 | $47,561 |
| 2021 | $765 | $36,841 | $4,467 | $32,374 |
| 2020 | $769 | $36,841 | $4,467 | $32,374 |
| 2019 | $795 | $36,841 | $4,467 | $32,374 |
| 2018 | $792 | $36,332 | $4,467 | $31,865 |
| 2017 | $768 | $36,332 | $4,467 | $31,865 |
| 2016 | $769 | $36,332 | $4,467 | $31,865 |
| 2015 | $769 | $36,332 | $4,467 | $31,865 |
| 2014 | $943 | $36,948 | $4,467 | $32,482 |
Source: Public Records
Map
Nearby Homes
- 4124 Country Ln
- 3366 Stockport Dr
- 3422 Firestone Dr
- 3434 Firestone Dr Unit 151
- 3424 Firestone Dr
- 3424 Firestone Dr Unit 155
- 3434 Firestone Dr
- 3422 Firestone Dr Unit 156
- Maywood 3 Plan at Laurel Park Townhomes
- 3440 Firestone Dr
- 3440 Firestone Dr Unit 148
- Stratford Plan at Laurel Park Townhomes
- 3428 Firestone Dr Unit 153
- Sudbury Plan at Laurel Park Townhomes
- 3432 Firestone Dr Unit 152
- 3420 Firestone Dr Unit 157
- 3418 Firestone Dr Unit 158
- 0 Talbot Dr
- 1054 Mizuno Dr
- 1058 Mizuno Dr
- 2511 Anthony Dejuan Pkwy
- 4110 Michael Place
- 4112 Michael Place
- 4117 N Allendale Ct
- 4114 Michael Place
- 2514 Anthony Dejuan Pkwy
- 4115 N Allendale Ct
- 2512 Anthony Dejuan Pkwy
- 4106 Michael Place
- 2509 Anthony Dejuan Pkwy
- 4116 Michael Place
- 4116 N Allendale Ct
- 4113 N Allendale Ct
- 4114 N Allendale Ct
- 2510 Anthony Dejuan Pkwy
- 4107 Michael Place
- 4109 Michael Place
- 4104 Michael Place
- 4105 Michael Place