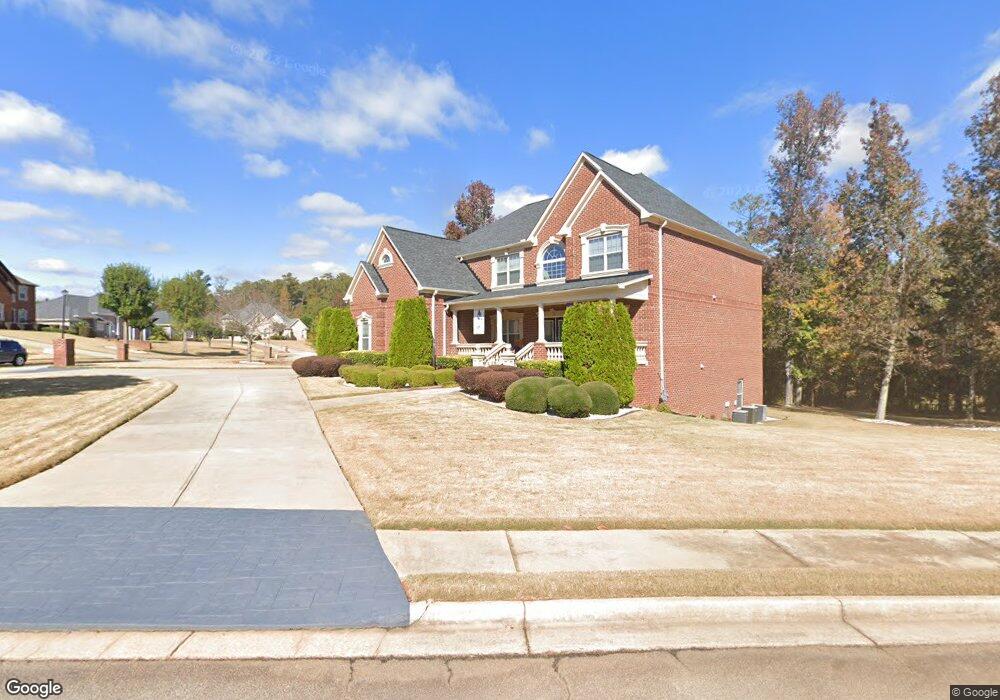
2513 Ashland Trace Conyers, GA 30094
Estimated Value: $479,381 - $667,000
5
Beds
4
Baths
3,356
Sq Ft
$169/Sq Ft
Est. Value
About This Home
This home is located at 2513 Ashland Trace, Conyers, GA 30094 and is currently estimated at $567,845, approximately $169 per square foot. 2513 Ashland Trace is a home located in Rockdale County with nearby schools including Lorraine Elementary School, Gen. Ray Davis Middle School, and Salem High School.
Ownership History
Date
Name
Owned For
Owner Type
Purchase Details
Closed on
Apr 23, 2008
Sold by
Wheeler Signature Homes Llc
Bought by
Clark Reginald B and Clark Paula M
Current Estimated Value
Home Financials for this Owner
Home Financials are based on the most recent Mortgage that was taken out on this home.
Original Mortgage
$341,910
Outstanding Balance
$215,113
Interest Rate
5.84%
Mortgage Type
New Conventional
Estimated Equity
$352,732
Purchase Details
Closed on
Mar 27, 2007
Sold by
G Tippens Construction Inc
Bought by
Wheeler Signature Homes Llc
Purchase Details
Closed on
Aug 30, 2006
Sold by
A & L Const
Bought by
G Tippens Const Inc
Home Financials for this Owner
Home Financials are based on the most recent Mortgage that was taken out on this home.
Original Mortgage
$300,000
Interest Rate
6.67%
Create a Home Valuation Report for This Property
The Home Valuation Report is an in-depth analysis detailing your home's value as well as a comparison with similar homes in the area
Home Values in the Area
Average Home Value in this Area
Purchase History
| Date | Buyer | Sale Price | Title Company |
|---|---|---|---|
| Clark Reginald B | $379,900 | -- | |
| Wheeler Signature Homes Llc | $70,000 | -- | |
| G Tippens Const Inc | $65,000 | -- |
Source: Public Records
Mortgage History
| Date | Status | Borrower | Loan Amount |
|---|---|---|---|
| Open | Clark Reginald B | $341,910 | |
| Previous Owner | G Tippens Const Inc | $300,000 |
Source: Public Records
Tax History Compared to Growth
Tax History
| Year | Tax Paid | Tax Assessment Tax Assessment Total Assessment is a certain percentage of the fair market value that is determined by local assessors to be the total taxable value of land and additions on the property. | Land | Improvement |
|---|---|---|---|---|
| 2024 | $5,741 | $225,400 | $39,800 | $185,600 |
| 2023 | $5,301 | $215,680 | $39,800 | $175,880 |
| 2022 | $4,356 | $178,880 | $35,280 | $143,600 |
| 2021 | $4,226 | $162,480 | $26,920 | $135,560 |
| 2020 | $3,806 | $140,680 | $25,800 | $114,880 |
| 2019 | $3,698 | $134,080 | $19,200 | $114,880 |
| 2018 | $3,590 | $129,840 | $14,840 | $115,000 |
| 2017 | $2,933 | $107,360 | $15,800 | $91,560 |
| 2016 | $2,709 | $107,360 | $15,800 | $91,560 |
| 2015 | $2,644 | $104,920 | $13,360 | $91,560 |
| 2014 | $2,361 | $104,920 | $13,360 | $91,560 |
| 2013 | -- | $134,760 | $30,000 | $104,760 |
Source: Public Records
Map
Nearby Homes
- 2206 Crescent Walk
- 2301 Mallory Cir Unit 2
- 2104 Crest Wood Dr
- 1433 Cotton Trail SW
- 2150 Oglesby Bridge Rd SW
- 1590 Colonial South Dr SW
- 1821 Holmes Dr SW
- 1840 Holmsey Cir
- 1709 Elizabeth Ct SW
- 246 Bridgewood Dr SE
- 1765 Elizabeth Ct SW
- 1938 Highway 212 SW
- 5162 Kurt Ln SW
- 1740 Elizabeth Ct SW
- 1769 Elizabeth Ct SW
- 4970 Hull Rd SE
- 4530 Wentworth Place SW
- 1721 Windsong Dr SW
- 5170 Paul Cir SW
- 1459 Highway 212 SW
- 0 Whippoorwill Way Unit 31 & 51 7277295
- 0 Whippoorwill Way Unit 8694590
- 0 Whippoorwill Way Unit 8312837
- 0 Whippoorwill Way Unit 8481929
- 0 Whippoorwill Way Unit 8643969
- 2509 Ashland Trace Unit 24
- 2509 Ashland Trace
- 2509 Ashland Trace Unit 31
- 0 Ashland Trace Unit 8680084
- 0 Ashland Trace Unit 8530703
- 0 Ashland Trace Unit 7626376
- 0 Ashland Trace Unit 7021456
- 0 Ashland Trace Unit 8200909
- 2517 Ashland Trace
- 2512 Ashland Trace
- 2508 Ashland Trace
- 2052 Whippoorwill Way Unit 2
- 2044 Whippoorwill Way Unit 2
- 2055 Whippoorwill Way
- 2505 Ashland Trace Unit 2