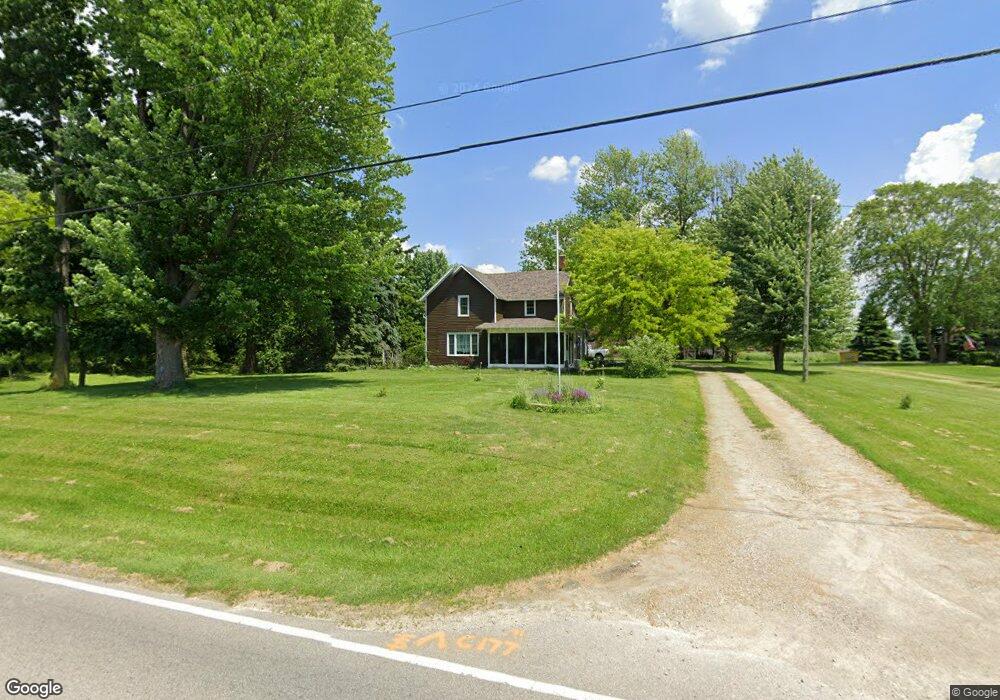
2513 Fangboner Rd Fremont, OH 43420
Estimated Value: $178,000 - $320,000
3
Beds
1
Bath
1,976
Sq Ft
$122/Sq Ft
Est. Value
About This Home
This home is located at 2513 Fangboner Rd, Fremont, OH 43420 and is currently estimated at $241,223, approximately $122 per square foot. 2513 Fangboner Rd is a home located in Sandusky County with nearby schools including Fremont Ross High School, St. Ann Catholic School, and St. Joseph School.
Ownership History
Date
Name
Owned For
Owner Type
Purchase Details
Closed on
Jul 26, 2017
Sold by
Schwochow Loren L and Schwochow Tawni A
Bought by
Brooks Philip M and Brooks Barbara
Current Estimated Value
Create a Home Valuation Report for This Property
The Home Valuation Report is an in-depth analysis detailing your home's value as well as a comparison with similar homes in the area
Home Values in the Area
Average Home Value in this Area
Purchase History
| Date | Buyer | Sale Price | Title Company |
|---|---|---|---|
| Brooks Philip M | $15,200 | Attorney | |
| Mehlow Allan E | $36,700 | Attorney |
Source: Public Records
Tax History Compared to Growth
Tax History
| Year | Tax Paid | Tax Assessment Tax Assessment Total Assessment is a certain percentage of the fair market value that is determined by local assessors to be the total taxable value of land and additions on the property. | Land | Improvement |
|---|---|---|---|---|
| 2024 | $2,480 | $57,890 | $16,940 | $40,950 |
| 2023 | $2,480 | $46,310 | $13,550 | $32,760 |
| 2022 | $2,147 | $46,310 | $13,550 | $32,760 |
| 2021 | $2,205 | $46,310 | $13,550 | $32,760 |
| 2020 | $2,207 | $45,580 | $13,200 | $32,380 |
| 2019 | $3,330 | $45,580 | $13,200 | $32,380 |
| 2018 | $2,836 | $45,580 | $13,200 | $32,380 |
| 2017 | $2,661 | $41,410 | $11,970 | $29,440 |
| 2016 | $3,212 | $51,110 | $21,670 | $29,440 |
| 2015 | $2,544 | $51,110 | $21,670 | $29,440 |
| 2014 | $3,308 | $47,080 | $16,940 | $30,140 |
| 2013 | $2,387 | $47,080 | $16,940 | $30,140 |
Source: Public Records
Map
Nearby Homes
- 0 Sean Dr
- Outlot A Sean Dr
- 2219 Oak Harbor Rd
- 1730 Port Clinton Rd Unit 33
- 1730 Port Clinton Rd
- 1730 Port Clinton Rd Unit 41
- 1441 White Ave
- 2100 Ohio 53
- 1720 North St
- 1227 White Ave
- 1707 North St
- 900 Spring St
- 711 Rawson Ave
- 711 Bloom Rd
- 927 Wolfe Ave
- 1823 W State St
- 816 Lime St
- 612 2nd St
- 516 N Front St
- 533 Sandusky Ave Unit 535
- 2475 Fangboner Rd
- 2569 Fangboner Rd
- 2536 Fangboner Rd
- 2562 Fangboner Rd
- 2490 Fangboner Rd
- 2665 Fangboner Rd
- 2574 Fangboner Rd
- 2390 Sean Dr
- 2390 Sean Dr Unit A
- 2390 Sean Dr Unit B
- 2380 Sean Dr
- 2380 Sean Dr Unit 107
- 2380 Sean Dr Unit 106
- 2557 Cherry Ridge Dr
- 2624 Fangboner Rd
- 2559 Cherry Ridge Dr
- 1600 Ell Dr
- 2642 Fangboner Rd
- 1611 Ell Dr
- 2607 Cherry Ridge Dr