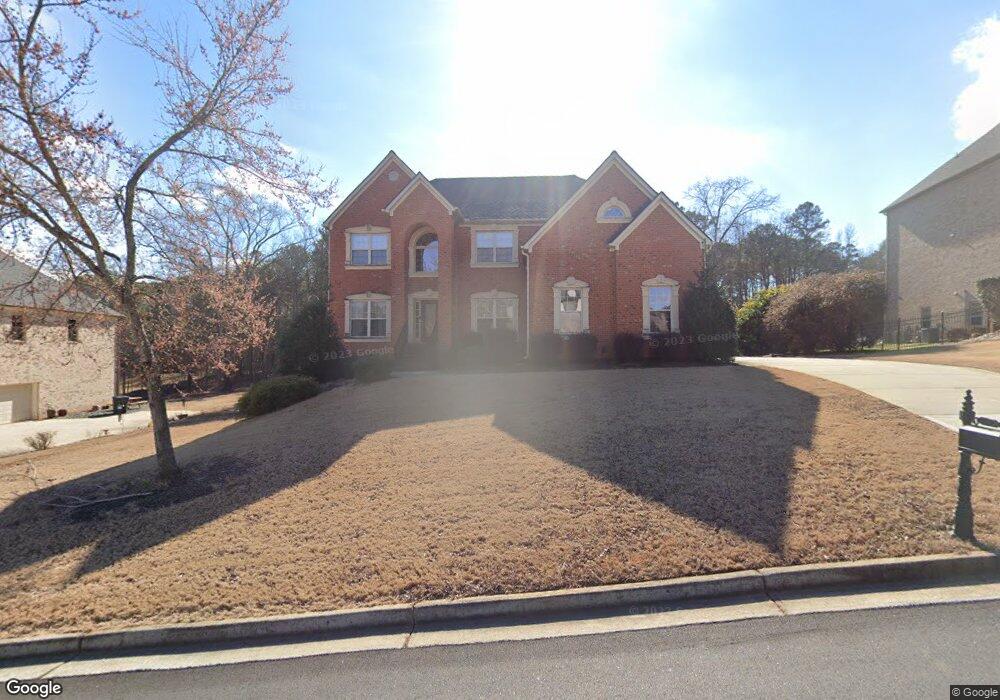
2513 Pattington Way NE Conyers, GA 30013
Estimated Value: $424,000 - $635,000
5
Beds
5
Baths
3,650
Sq Ft
$151/Sq Ft
Est. Value
About This Home
This home is located at 2513 Pattington Way NE, Conyers, GA 30013 and is currently estimated at $550,961, approximately $150 per square foot. 2513 Pattington Way NE is a home located in Rockdale County with nearby schools including Hightower Trail Elementary School, Memorial Middle School, and Salem High School.
Ownership History
Date
Name
Owned For
Owner Type
Purchase Details
Closed on
Nov 3, 2008
Sold by
Horizon Homebuilders Inc
Bought by
Floyd Felix M and Floyd Johnelle C
Current Estimated Value
Home Financials for this Owner
Home Financials are based on the most recent Mortgage that was taken out on this home.
Original Mortgage
$351,443
Outstanding Balance
$231,037
Interest Rate
6.11%
Mortgage Type
FHA
Estimated Equity
$319,924
Purchase Details
Closed on
Sep 5, 2008
Sold by
Wes Bonner Homes Inc
Bought by
Horizon Homebuilders Inc
Home Financials for this Owner
Home Financials are based on the most recent Mortgage that was taken out on this home.
Original Mortgage
$351,443
Outstanding Balance
$231,037
Interest Rate
6.11%
Mortgage Type
FHA
Estimated Equity
$319,924
Purchase Details
Closed on
Feb 4, 2008
Sold by
Levenboro Dev Llc
Bought by
Wes Bonner Homes Inc
Home Financials for this Owner
Home Financials are based on the most recent Mortgage that was taken out on this home.
Original Mortgage
$303,750
Interest Rate
6.17%
Create a Home Valuation Report for This Property
The Home Valuation Report is an in-depth analysis detailing your home's value as well as a comparison with similar homes in the area
Home Values in the Area
Average Home Value in this Area
Purchase History
| Date | Buyer | Sale Price | Title Company |
|---|---|---|---|
| Floyd Felix M | $386,900 | -- | |
| Horizon Homebuilders Inc | $70,000 | -- | |
| Wes Bonner Homes Inc | $65,000 | -- |
Source: Public Records
Mortgage History
| Date | Status | Borrower | Loan Amount |
|---|---|---|---|
| Open | Floyd Felix M | $351,443 | |
| Previous Owner | Horizon Homebuilders Inc | $270,000 | |
| Previous Owner | Wes Bonner Homes Inc | $303,750 |
Source: Public Records
Tax History Compared to Growth
Tax History
| Year | Tax Paid | Tax Assessment Tax Assessment Total Assessment is a certain percentage of the fair market value that is determined by local assessors to be the total taxable value of land and additions on the property. | Land | Improvement |
|---|---|---|---|---|
| 2024 | $5,375 | $210,560 | $54,720 | $155,840 |
| 2023 | $4,474 | $182,360 | $52,200 | $130,160 |
| 2022 | $3,958 | $162,280 | $51,600 | $110,680 |
| 2021 | $4,399 | $167,720 | $35,600 | $132,120 |
| 2020 | $4,453 | $161,320 | $32,800 | $128,520 |
| 2019 | $3,536 | $127,920 | $20,800 | $107,120 |
| 2018 | $3,385 | $122,320 | $15,200 | $107,120 |
| 2017 | $3,371 | $120,440 | $15,200 | $105,240 |
| 2016 | $3,116 | $120,440 | $15,200 | $105,240 |
| 2015 | $3,115 | $120,200 | $14,800 | $105,400 |
| 2014 | $2,771 | $119,720 | $14,800 | $104,920 |
| 2013 | -- | $118,680 | $18,000 | $100,680 |
Source: Public Records
Map
Nearby Homes
- 360 Glen Rd NE
- 2567 Gees Mill Rd NE
- 2545 Pattington Way NE
- 2615 Glendale Dr NE
- 1833 Millstone Manor
- 2479 Honey Way
- 2477 Honey Way
- 2710 Glendale Dr NE
- 2553 Riverside Rd
- 2551 Riverside Rd
- 2544 Riverside Rd
- 2516 Riverside Rd
- 2526 Riverside Rd
- 2548 Riverside Rd
- 1869 Millstone Manor
- 2725 Bailey Place NE
- 1509 Aralynn Way Unit 1
- 2260 Ashton Ridge Dr SE
- 1513 Aralynn Ct Unit 3
- 2100 NE Adel Rd
- 2517 Pattington Way NE
- 2517 Pattington Way NE Unit 42
- 2509 Pattington Way NE
- 2505 Pattington Way NE
- 2505 Pattington Way NE Unit 45
- 2701 Ratby Ln NE
- 2601 Bosworth Ct NE
- 2705 Ratby Ln NE
- 2700 Ratby Ln NE
- 2501 Pattington Way NE Unit LOT 46
- 2501 Pattington Way NE
- 2500 Pattington Way NE
- 355 Glen Rd NE
- 2520 Pattington Way NE
- 2709 Ratby Ln NE Unit 40
- 2607 Bosworth Ct NE Unit LOT 5
- 2607 Bosworth Ct NE
- 2607 Bosworth Ct NE Unit 5
- 2606 Bosworth Ct NE
- 2524 Pattington Way NE