Estimated Value: $282,103 - $298,000
3
Beds
2
Baths
1,815
Sq Ft
$159/Sq Ft
Est. Value
About This Home
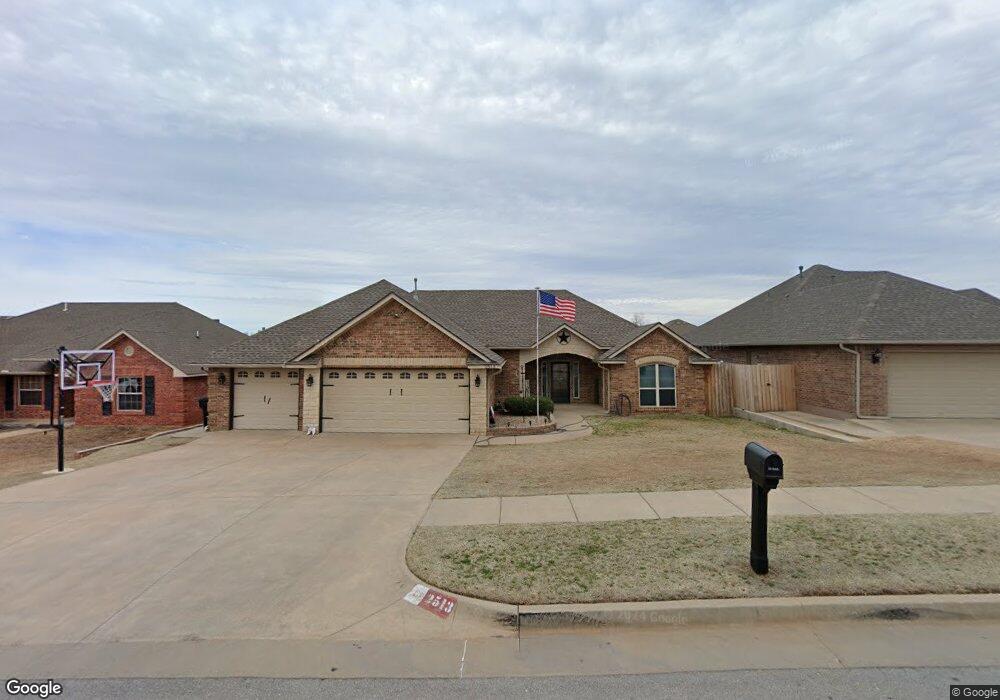
This home is located at 2513 SE 9th St, Moore, OK 73160 and is currently estimated at $287,776, approximately $158 per square foot. 2513 SE 9th St is a home located in Cleveland County with nearby schools including Heritage Trails Elementary School, Highland East Junior High School, and Moore High School.
Ownership History
Date
Name
Owned For
Owner Type
Purchase Details
Closed on
Nov 7, 2014
Sold by
Hamilton Nathan P and Hamilton Courtni R
Bought by
Wakeham Mark A and Wakeham Kelly A
Current Estimated Value
Home Financials for this Owner
Home Financials are based on the most recent Mortgage that was taken out on this home.
Original Mortgage
$196,166
Outstanding Balance
$149,264
Interest Rate
4.21%
Mortgage Type
VA
Estimated Equity
$138,512
Purchase Details
Closed on
Aug 29, 2008
Sold by
Home First Inc
Bought by
Hamilton Nathan P and Hamilton Courtni R
Home Financials for this Owner
Home Financials are based on the most recent Mortgage that was taken out on this home.
Original Mortgage
$164,531
Interest Rate
6.66%
Mortgage Type
FHA
Purchase Details
Closed on
Apr 11, 2008
Sold by
Shingleton Simon B and Shington Rachel L
Bought by
Home First Inc
Home Financials for this Owner
Home Financials are based on the most recent Mortgage that was taken out on this home.
Original Mortgage
$138,400
Interest Rate
6.11%
Mortgage Type
Construction
Create a Home Valuation Report for This Property
The Home Valuation Report is an in-depth analysis detailing your home's value as well as a comparison with similar homes in the area
Home Values in the Area
Average Home Value in this Area
Purchase History
| Date | Buyer | Sale Price | Title Company |
|---|---|---|---|
| Wakeham Mark A | $190,000 | The Oklahoma City Abstract & | |
| Hamilton Nathan P | $173,000 | Fa | |
| Home First Inc | $28,500 | None Available |
Source: Public Records
Mortgage History
| Date | Status | Borrower | Loan Amount |
|---|---|---|---|
| Open | Wakeham Mark A | $196,166 | |
| Previous Owner | Hamilton Nathan P | $164,531 | |
| Previous Owner | Home First Inc | $138,400 |
Source: Public Records
Tax History
| Year | Tax Paid | Tax Assessment Tax Assessment Total Assessment is a certain percentage of the fair market value that is determined by local assessors to be the total taxable value of land and additions on the property. | Land | Improvement |
|---|---|---|---|---|
| 2025 | -- | $27,007 | $4,375 | $22,632 |
| 2023 | $0 | $25,456 | $4,603 | $20,853 |
| 2022 | $0 | $24,715 | $4,496 | $20,219 |
| 2021 | $2,999 | $24,132 | $3,990 | $20,142 |
| 2020 | $2,896 | $23,296 | $3,771 | $19,525 |
| 2019 | $2,810 | $22,187 | $3,000 | $19,187 |
| 2018 | $2,773 | $21,892 | $3,000 | $18,892 |
| 2017 | $2,788 | $21,892 | $0 | $0 |
| 2016 | $2,807 | $21,892 | $3,000 | $18,892 |
| 2015 | $2,511 | $21,643 | $3,106 | $18,537 |
| 2014 | $2,341 | $20,714 | $3,106 | $17,608 |
Source: Public Records
Map
Nearby Homes
- 1117 Kelsi Dr
- 2504 SE 11th St
- 2433 SE 12th St
- 605 Kelsi Dr
- 1113 Lanie Ln
- 2200 SE 8th St
- 1009 Samantha Ln
- 2113 SE 8th St
- 2636 SE 5th St
- 2804 SE 8th St
- 2304 SE 5th St
- 1009 Ashwood Ln
- 2025 Wimberley Creek Dr
- 1113 Lindsey Ln
- 105 S Olde Bridge Rd
- 517 Cottonwood Dr
- 1805 SE 13th St
- 401 S Bryant Ave
- 1733 Pin Cherry Ln
- 1800 Pin Cherry Ln
Your Personal Tour Guide
Ask me questions while you tour the home.