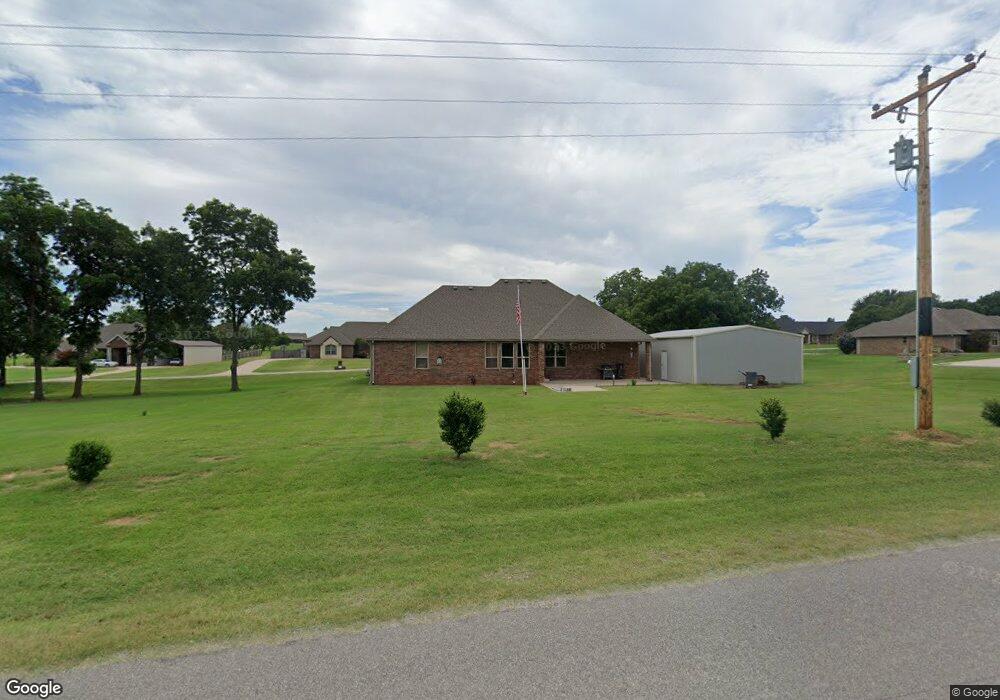
25135 Karly Way Purcell, OK 73080
Estimated Value: $334,000 - $351,000
3
Beds
2
Baths
1,986
Sq Ft
$172/Sq Ft
Est. Value
About This Home
This home is located at 25135 Karly Way, Purcell, OK 73080 and is currently estimated at $341,320, approximately $171 per square foot. 25135 Karly Way is a home located in McClain County with nearby schools including Purcell Elementary School, Purcell Intermediate School, and Purcell Junior High School.
Ownership History
Date
Name
Owned For
Owner Type
Purchase Details
Closed on
Jun 1, 2012
Sold by
Fay Bryen Leonard Junior and Fay Bryen Nola
Bought by
The Leonard Junior Bryen & Nola Fay Brye
Current Estimated Value
Purchase Details
Closed on
Mar 30, 2011
Sold by
Galyean Gil and Galyean Becky
Bought by
Bryen Leonard J and Bryen Nola F
Purchase Details
Closed on
Jul 8, 2008
Sold by
David Dean Construction Inc
Bought by
Galyean Gil and Galyean Becky
Purchase Details
Closed on
May 23, 2007
Sold by
Thorntons Landing Llc
Bought by
David Dean Construction Inc
Home Financials for this Owner
Home Financials are based on the most recent Mortgage that was taken out on this home.
Original Mortgage
$142,016
Interest Rate
6.16%
Mortgage Type
Construction
Create a Home Valuation Report for This Property
The Home Valuation Report is an in-depth analysis detailing your home's value as well as a comparison with similar homes in the area
Home Values in the Area
Average Home Value in this Area
Purchase History
| Date | Buyer | Sale Price | Title Company |
|---|---|---|---|
| The Leonard Junior Bryen & Nola Fay Brye | -- | None Available | |
| Bryen Leonard J | $185,000 | None Available | |
| Galyean Gil | $189,000 | None Available | |
| David Dean Construction Inc | $17,500 | None Available |
Source: Public Records
Mortgage History
| Date | Status | Borrower | Loan Amount |
|---|---|---|---|
| Previous Owner | David Dean Construction Inc | $142,016 |
Source: Public Records
Tax History Compared to Growth
Tax History
| Year | Tax Paid | Tax Assessment Tax Assessment Total Assessment is a certain percentage of the fair market value that is determined by local assessors to be the total taxable value of land and additions on the property. | Land | Improvement |
|---|---|---|---|---|
| 2025 | -- | $28,280 | $3,271 | $25,009 |
| 2024 | -- | $27,455 | $3,175 | $24,280 |
| 2023 | $0 | $26,656 | $2,934 | $23,722 |
| 2022 | $0 | $25,879 | $2,602 | $23,277 |
| 2021 | $0 | $25,126 | $2,145 | $22,981 |
| 2020 | $0 | $24,394 | $1,944 | $22,450 |
| 2019 | $2,181 | $24,627 | $1,944 | $22,683 |
| 2018 | $0 | $24,859 | $1,944 | $22,915 |
| 2017 | $0 | $24,188 | $1,944 | $22,244 |
| 2016 | $0 | $23,500 | $1,944 | $21,556 |
| 2015 | $2,521 | $24,088 | $1,568 | $22,520 |
| 2014 | $2,480 | $22,941 | $1,502 | $21,439 |
Source: Public Records
Map
Nearby Homes
- 1930 Deer Trail
- 18304 Johnson Ave
- 19733 Johnson Ave
- 18724 Horse Ave
- 0 Johnson Ave
- 0 Oklahoma 39
- 20227 Holiday Ct
- 20196 Holiday Ct
- 16965 Horse Ave
- 0000 Oklahoma 39
- 1102 Parkview Cir
- 20267 Horse Ave
- 0000 Sooner Ave
- 1216 S Brook Dr
- 1225 Meadow Brook Dr
- 1233 S Brook Dr
- 1212 S Brook Dr
- 1229 Meadow Brook Dr
- 832 W Adams St
- 1007 S Canadian Ave
- 25122 Karly Way
- 25177 Karly Way
- 25154 Karly Way
- 25085 Karly Way
- 25147 190th St
- 25223 Karly Way
- 21908 201st St
- 21295 201st St
- 25207 190th St
- 25078 Karly Way
- 25059 Karly Way
- 25052 Karly Way
- 25021 Karly Way
- 25075 190th St
- 25129 Kody Ln
- 25085 Kody Ln
- 25175 Kody Ln
- 25345 Kody Ln
- 25219 Kody Ln
- 25016 Karly Way