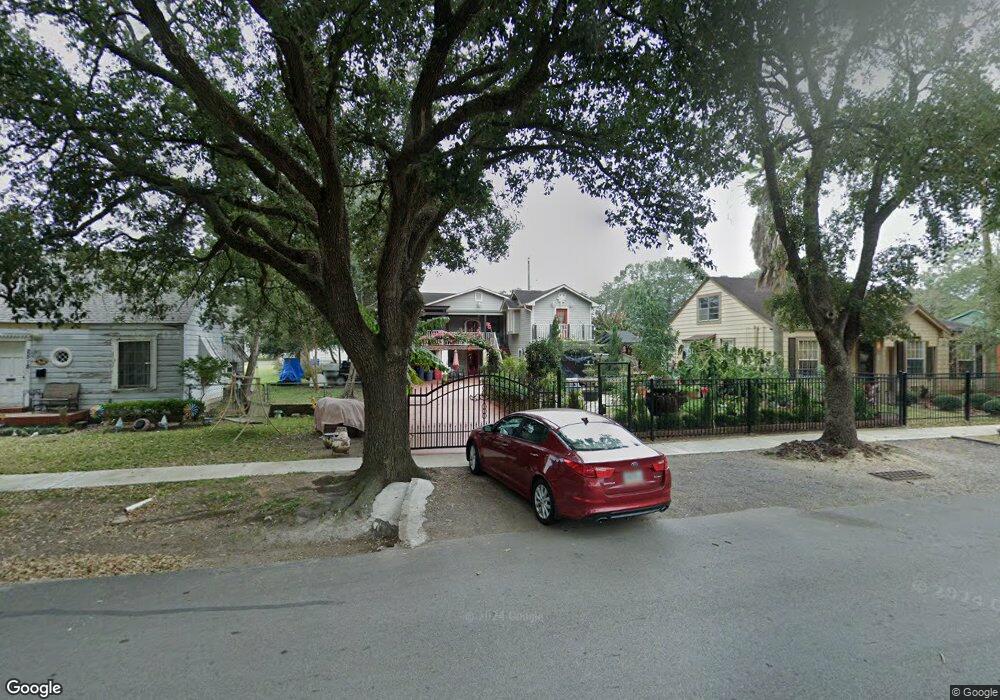
2514 Avenue F Rosenberg, TX 77471
Estimated Value: $235,000 - $282,340
3
Beds
2
Baths
2,496
Sq Ft
$105/Sq Ft
Est. Value
About This Home
This home is located at 2514 Avenue F, Rosenberg, TX 77471 and is currently estimated at $261,335, approximately $104 per square foot. 2514 Avenue F is a home located in Fort Bend County with nearby schools including Travis Elementary School, Navarro Middle School, and George Junior High School.
Ownership History
Date
Name
Owned For
Owner Type
Purchase Details
Closed on
Oct 15, 2017
Sold by
Lopez Feliciano and Lopez Josefina B
Bought by
Cardenas Silvia B
Current Estimated Value
Home Financials for this Owner
Home Financials are based on the most recent Mortgage that was taken out on this home.
Original Mortgage
$50,000
Interest Rate
3.82%
Mortgage Type
Purchase Money Mortgage
Purchase Details
Closed on
Oct 18, 2011
Sold by
Acosta Juan Chavez
Bought by
Cardenas Silvia
Home Financials for this Owner
Home Financials are based on the most recent Mortgage that was taken out on this home.
Original Mortgage
$14,000
Interest Rate
4.17%
Mortgage Type
Seller Take Back
Purchase Details
Closed on
Aug 4, 2005
Sold by
Nieto Guadalupe G and Nieto Lenora
Bought by
Cardenas Sylvia
Create a Home Valuation Report for This Property
The Home Valuation Report is an in-depth analysis detailing your home's value as well as a comparison with similar homes in the area
Home Values in the Area
Average Home Value in this Area
Purchase History
| Date | Buyer | Sale Price | Title Company |
|---|---|---|---|
| Cardenas Silvia B | -- | None Available | |
| Cardenas Silvia | -- | None Available | |
| Cardenas Sylvia | -- | -- |
Source: Public Records
Mortgage History
| Date | Status | Borrower | Loan Amount |
|---|---|---|---|
| Closed | Cardenas Silvia B | $50,000 | |
| Previous Owner | Cardenas Silvia | $14,000 |
Source: Public Records
Tax History Compared to Growth
Tax History
| Year | Tax Paid | Tax Assessment Tax Assessment Total Assessment is a certain percentage of the fair market value that is determined by local assessors to be the total taxable value of land and additions on the property. | Land | Improvement |
|---|---|---|---|---|
| 2025 | $1,259 | $152,027 | $26,398 | $241,622 |
| 2024 | $1,259 | $138,206 | -- | $273,485 |
| 2023 | $1,080 | $125,642 | $0 | $279,533 |
| 2022 | $1,658 | $114,220 | $0 | $147,330 |
| 2021 | $2,154 | $103,840 | $15,840 | $88,000 |
| 2020 | $2,246 | $105,830 | $15,840 | $89,990 |
| 2019 | $2,374 | $103,940 | $15,840 | $88,100 |
| 2018 | $2,323 | $100,080 | $15,840 | $84,240 |
| 2017 | $2,274 | $97,410 | $15,840 | $81,570 |
| 2016 | $2,277 | $97,550 | $15,840 | $81,710 |
| 2015 | $1,865 | $99,450 | $15,840 | $83,610 |
| 2014 | $2,021 | $99,060 | $15,840 | $83,220 |
Source: Public Records
Map
Nearby Homes
- 804 Ward St
- 2513 Avenue H
- 1210 San Jacinto St
- 1108 Macarthur St
- 905 5th St
- 901 5th St
- 2409 Avenue K
- 1314 Avenue G
- 1212 Alamo St
- 305 7th St
- 420 4th St
- 1410 8th St
- 1401 5th St
- 413 2nd St
- 2519 Good Morrow Dr
- 5534 Handlewood Ln
- 2606 Good Morrow Dr
- 2630 Wastelbread Ln
- 2619 Wastelbread Ln
- 2515 Good Morrow Dr