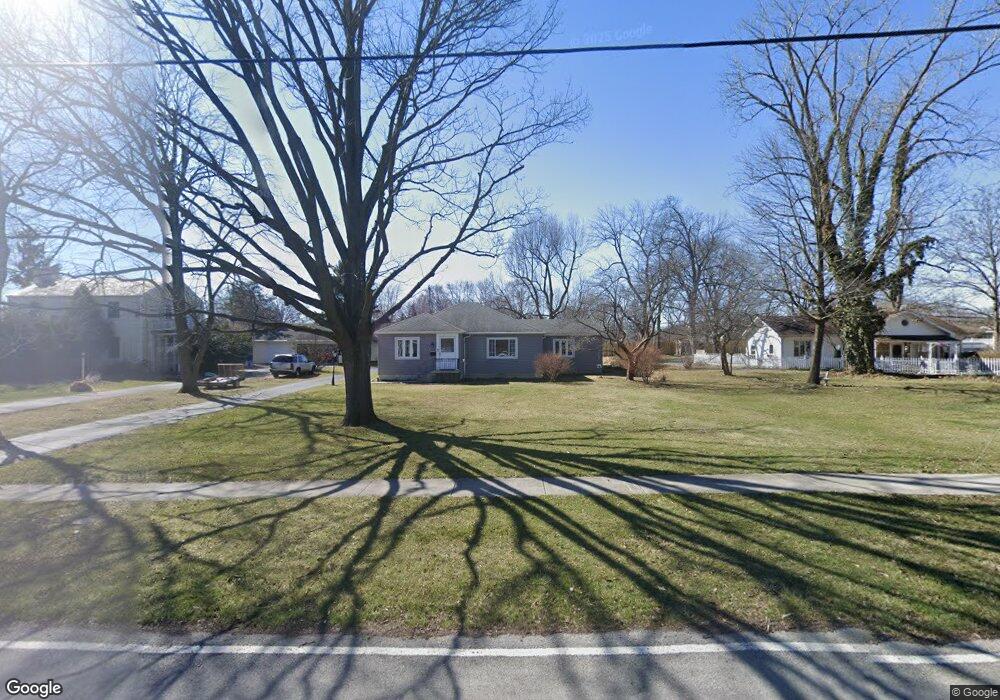
2514 S Main St Findlay, OH 45840
Estimated Value: $233,000 - $292,000
3
Beds
2
Baths
1,898
Sq Ft
$134/Sq Ft
Est. Value
About This Home
This home is located at 2514 S Main St, Findlay, OH 45840 and is currently estimated at $253,672, approximately $133 per square foot. 2514 S Main St is a home located in Hancock County with nearby schools including Chamberlin Hill Elementary School, Jefferson Elementary School, and Donnell Middle School.
Ownership History
Date
Name
Owned For
Owner Type
Purchase Details
Closed on
Nov 1, 2019
Sold by
Price Loni E and Sheaffer Nancy R
Bought by
Crusa Charles W
Current Estimated Value
Home Financials for this Owner
Home Financials are based on the most recent Mortgage that was taken out on this home.
Original Mortgage
$143,925
Outstanding Balance
$126,868
Interest Rate
3.7%
Mortgage Type
New Conventional
Estimated Equity
$126,804
Purchase Details
Closed on
Jun 7, 2001
Sold by
Seemann Robert A
Bought by
Reusch Loni J
Purchase Details
Closed on
Dec 12, 2000
Sold by
Reichert Richard A
Bought by
Seemann Robert A
Home Financials for this Owner
Home Financials are based on the most recent Mortgage that was taken out on this home.
Original Mortgage
$65,000
Interest Rate
7.7%
Mortgage Type
New Conventional
Create a Home Valuation Report for This Property
The Home Valuation Report is an in-depth analysis detailing your home's value as well as a comparison with similar homes in the area
Home Values in the Area
Average Home Value in this Area
Purchase History
| Date | Buyer | Sale Price | Title Company |
|---|---|---|---|
| Crusa Charles W | $151,500 | None Available | |
| Reusch Loni J | $56,000 | -- | |
| Seemann Robert A | $112,500 | -- |
Source: Public Records
Mortgage History
| Date | Status | Borrower | Loan Amount |
|---|---|---|---|
| Open | Crusa Charles W | $143,925 | |
| Previous Owner | Seemann Robert A | $65,000 |
Source: Public Records
Tax History Compared to Growth
Tax History
| Year | Tax Paid | Tax Assessment Tax Assessment Total Assessment is a certain percentage of the fair market value that is determined by local assessors to be the total taxable value of land and additions on the property. | Land | Improvement |
|---|---|---|---|---|
| 2024 | $2,106 | $59,280 | $12,290 | $46,990 |
| 2023 | $2,109 | $59,280 | $12,290 | $46,990 |
| 2022 | $2,102 | $59,280 | $12,290 | $46,990 |
| 2021 | $1,972 | $48,460 | $12,270 | $36,190 |
| 2020 | $1,972 | $48,460 | $12,270 | $36,190 |
| 2019 | $1,932 | $48,460 | $12,270 | $36,190 |
| 2018 | $1,892 | $42,360 | $10,670 | $31,690 |
| 2017 | $946 | $42,360 | $10,670 | $31,690 |
| 2016 | $1,869 | $42,360 | $10,670 | $31,690 |
| 2015 | $1,958 | $43,540 | $9,640 | $33,900 |
| 2014 | $1,958 | $43,540 | $9,640 | $33,900 |
| 2012 | $1,534 | $43,540 | $9,640 | $33,900 |
Source: Public Records
Map
Nearby Homes
- 164 Church Hill Dr
- 401 Bittersweet Dr
- 500 Blue Bonnet Dr
- 242 E Yates Ave
- 200 E Edgar Ave
- 0 Viburnum Ct Unit 6121366
- 0 Viburnum Ct Unit 20243687
- 0 Virbunum Ct Unit 87 305267
- 3065 S Main St
- 1705 S Main St
- 211 Fairlawn Place
- 1727 Washington Ave
- 1621 S Main St
- 0 Township Road 77
- 0 Penrose Dr
- 3323 Western Ave
- 1818 Westview Dr
- 1421 Hurd Ave
- 123 Glendale Ave
- 1726 Eastview Dr
- 2500 S Main St
- 2516 S Main St
- 120 Blue Bonnet Dr
- 2436 S Main St
- 121 Orchard Ln
- 2501 S Main St
- 2600 S Main St
- 130 Blue Bonnet Dr
- 121 Blue Bonnet Dr
- 100 Beechmont Dr
- 135 Orchard Ln
- 2432 S Main St
- 131 Olive St
- 2606 S Main St
- 140 Blue Bonnet Dr
- 120 Orchard Ln
- 2615 Goldenrod Ln
- 130 Olive St
- 143 Orchard Ln
- 128 Orchard Ln