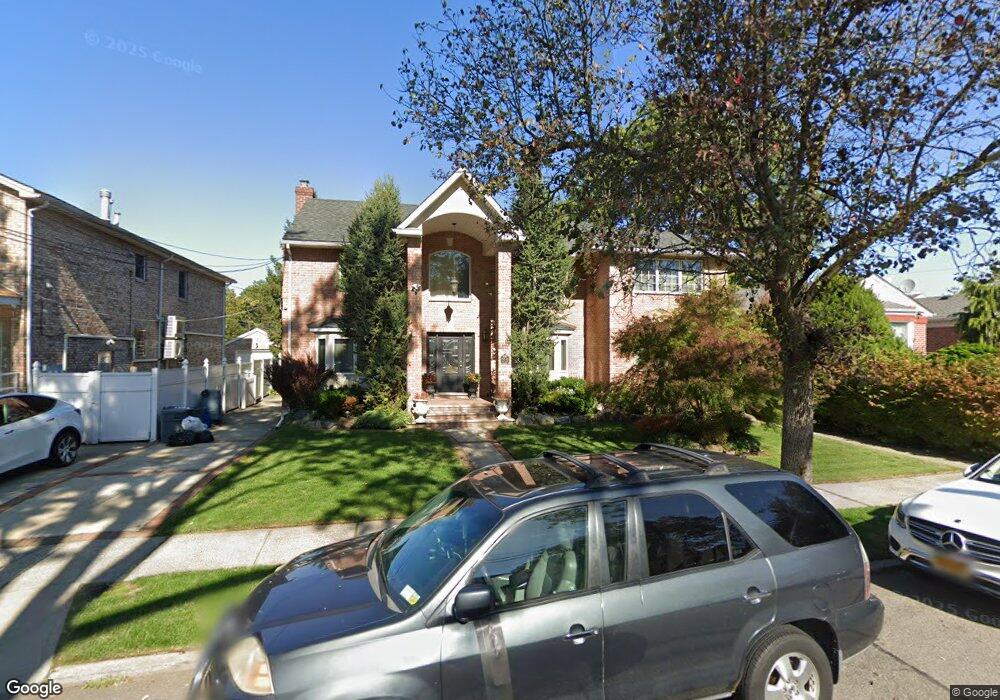
25143 57th Ave Unit 2 Fl Little Neck, NY 11362
Little Neck NeighborhoodEstimated Value: $1,647,000 - $2,125,000
4
Beds
2
Baths
2,964
Sq Ft
$614/Sq Ft
Est. Value
About This Home
This home is located at 25143 57th Ave Unit 2 Fl, Little Neck, NY 11362 and is currently estimated at $1,819,300, approximately $613 per square foot. 25143 57th Ave Unit 2 Fl is a home located in Queens County with nearby schools including P.S. 221Q The North Hills School, Louis Pasteur Middle School 67, and Benjamin N Cardozo High School.
Ownership History
Date
Name
Owned For
Owner Type
Purchase Details
Closed on
Jul 2, 2015
Sold by
Dinapoli Daniel and Isopo Christina
Bought by
Huang Changkang and Huang Zhejun
Current Estimated Value
Purchase Details
Closed on
Jan 28, 2005
Sold by
Isopo Paola
Bought by
Dinapoli Daniel and Isopo Christina
Purchase Details
Closed on
Jan 2, 1998
Sold by
Deluca Alma
Bought by
Isopo Paola
Home Financials for this Owner
Home Financials are based on the most recent Mortgage that was taken out on this home.
Original Mortgage
$150,000
Interest Rate
7.02%
Create a Home Valuation Report for This Property
The Home Valuation Report is an in-depth analysis detailing your home's value as well as a comparison with similar homes in the area
Home Values in the Area
Average Home Value in this Area
Purchase History
| Date | Buyer | Sale Price | Title Company |
|---|---|---|---|
| Huang Changkang | $1,339,000 | -- | |
| Huang Changkang | $1,339,000 | -- | |
| Dinapoli Daniel | -- | -- | |
| Dinapoli Daniel | -- | -- | |
| Isopo Paola | $352,500 | First American Title Ins Co | |
| Isopo Paola | $352,500 | First American Title Ins Co |
Source: Public Records
Mortgage History
| Date | Status | Borrower | Loan Amount |
|---|---|---|---|
| Previous Owner | Isopo Paola | $150,000 | |
| Closed | Dinapoli Daniel | $0 |
Source: Public Records
Tax History Compared to Growth
Tax History
| Year | Tax Paid | Tax Assessment Tax Assessment Total Assessment is a certain percentage of the fair market value that is determined by local assessors to be the total taxable value of land and additions on the property. | Land | Improvement |
|---|---|---|---|---|
| 2025 | $14,180 | $74,065 | $11,246 | $62,819 |
| 2024 | $14,180 | $70,601 | $12,846 | $57,755 |
| 2023 | $14,180 | $70,601 | $11,759 | $58,842 |
| 2022 | $13,934 | $76,800 | $15,360 | $61,440 |
| 2021 | $13,768 | $82,140 | $15,360 | $66,780 |
| 2020 | $13,064 | $90,300 | $15,360 | $74,940 |
| 2019 | $12,307 | $97,920 | $15,360 | $82,560 |
| 2018 | $11,993 | $58,834 | $9,838 | $48,996 |
| 2017 | $11,655 | $57,176 | $10,606 | $46,570 |
| 2016 | $10,589 | $57,176 | $10,606 | $46,570 |
| 2015 | $6,286 | $51,434 | $13,894 | $37,540 |
| 2014 | $6,286 | $49,029 | $14,977 | $34,052 |
Source: Public Records
Map
Nearby Homes
- 57-10 253rd St
- 251-26 58th Ave Unit Upper
- 251-16 58th Ave Unit 1-25
- 252-20 58th Ave Unit 2 Fl
- 58-05 251st St Unit 1-47
- 253-12 58th Ave
- 58-49 251st St Unit 1 Floor
- 249-52 57th Ave Unit 1-245
- 58- 20 251st St Unit 2nd floor
- 58-30 254th St
- 53-15 251st Place
- 58-28 251st St Unit 2
- 249-42 57th Ave Unit 2
- 252-15 60th Ave Unit 1-114
- 58- 30 251st St Unit 2nd
- 249-30 57th Ave Unit 1
- 60-31 251st St Unit 2-814
- 57-03 Marathon Pkwy Unit 250 (Lower)
- 53-34 Browvale Ln
- 57- 45 Marathon Pkwy Unit Uppr
- 25143 57th Ave Unit Fl 1
- 25143 57th Ave
- 25143 57th Ave
- 251-35 57th Ave
- 251-35 57th Ave Unit 2nd Fl
- 25135 57th Ave
- 25149 57th Ave
- 251-49 57th Ave
- 57-00 253rd St Unit 2F
- 57-0 253rd St Unit 2
- 57-0 253rd St
- 25133 57th Ave
- 25153 57th Ave
- 57-14 253rd St
- 5704 253rd St
- 25129 57th Ave
- 25200 Horace Harding Expy
- 25301 57th Ave
- 251-25 57th Ave
- 5710 253rd St