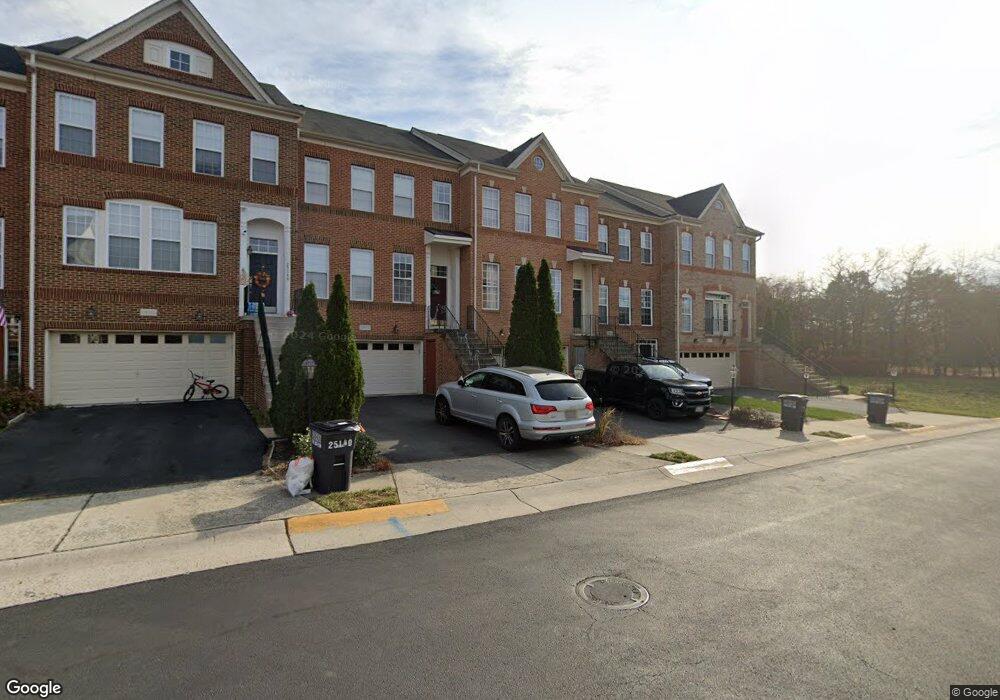
25144 Pennywort Terrace Stone Ridge, VA 20105
Estimated Value: $687,000 - $703,000
3
Beds
4
Baths
--
Sq Ft
2,614
Sq Ft Lot
About This Home
This home is located at 25144 Pennywort Terrace, Stone Ridge, VA 20105 and is currently estimated at $692,283. 25144 Pennywort Terrace is a home located in Loudoun County with nearby schools including Arcola Elementary School, Mercer Middle School, and John Champe High School.
Ownership History
Date
Name
Owned For
Owner Type
Purchase Details
Closed on
Mar 2, 2021
Sold by
Gainer Thomas F and Gainer Nicole R
Bought by
Gainer Nicole R and Adams Benjamin J
Current Estimated Value
Purchase Details
Closed on
Apr 28, 2017
Sold by
Bojji Krishna M and Rusum Rupa
Bought by
Gainer Thomas F and Gainer Nicole R
Home Financials for this Owner
Home Financials are based on the most recent Mortgage that was taken out on this home.
Original Mortgage
$411,782
Outstanding Balance
$339,109
Interest Rate
3.75%
Mortgage Type
FHA
Estimated Equity
$353,174
Purchase Details
Closed on
Aug 25, 2006
Sold by
Van Metre Homes @ Stone R
Bought by
Rusum Rupa and Bojji,Krishna M
Home Financials for this Owner
Home Financials are based on the most recent Mortgage that was taken out on this home.
Original Mortgage
$355,600
Interest Rate
6.71%
Mortgage Type
New Conventional
Create a Home Valuation Report for This Property
The Home Valuation Report is an in-depth analysis detailing your home's value as well as a comparison with similar homes in the area
Home Values in the Area
Average Home Value in this Area
Purchase History
| Date | Buyer | Sale Price | Title Company |
|---|---|---|---|
| Gainer Nicole R | -- | None Available | |
| Gainer Thomas F | $426,000 | Mid Atlantic Settlement Svcs | |
| Rusum Rupa | $450,714 | -- |
Source: Public Records
Mortgage History
| Date | Status | Borrower | Loan Amount |
|---|---|---|---|
| Open | Gainer Thomas F | $411,782 | |
| Previous Owner | Rusum Rupa | $355,600 |
Source: Public Records
Tax History Compared to Growth
Tax History
| Year | Tax Paid | Tax Assessment Tax Assessment Total Assessment is a certain percentage of the fair market value that is determined by local assessors to be the total taxable value of land and additions on the property. | Land | Improvement |
|---|---|---|---|---|
| 2025 | $5,304 | $658,880 | $220,000 | $438,880 |
| 2024 | $5,412 | $625,680 | $200,000 | $425,680 |
| 2023 | $5,085 | $581,170 | $200,000 | $381,170 |
| 2022 | $5,004 | $562,270 | $185,000 | $377,270 |
| 2021 | $4,898 | $499,770 | $165,000 | $334,770 |
| 2020 | $4,716 | $455,690 | $140,000 | $315,690 |
| 2019 | $4,528 | $433,300 | $140,000 | $293,300 |
| 2018 | $4,508 | $415,480 | $125,000 | $290,480 |
| 2017 | $4,536 | $403,210 | $125,000 | $278,210 |
| 2016 | $4,531 | $395,720 | $0 | $0 |
| 2015 | $4,506 | $271,960 | $0 | $271,960 |
| 2014 | $4,333 | $260,130 | $0 | $260,130 |
Source: Public Records
Map
Nearby Homes
- 42006 Kudu Ct
- 41925 Moreland Mine Terrace
- 25272 Oribi Place
- 24994 White Fir Ct
- 25362 Vacation Place
- 41725 McMonagle Square
- 25381 Patriot Terrace
- Tia 24-F2 Plan at Prosperity Plains
- 25202 Justice Dr
- 24769 Stone Pillar Dr
- 42344 Abney Wood Dr
- 25184 Crested Wheat Dr
- 24876 Helms Terrace
- 25427 Elm Terrace
- Sullivan 31-F2 Plan at South 620 - Single Family Home
- Vesper 34-F2 Plan at South 620 - Villa
- Vida 34-F2 Plan at South 620 - Villa
- 25174 Coats Square
- 24821 Beardgrass Place
- Tyson 28-D1 Plan at South 620 - Townhome
- 25146 Pennywort Terrace
- 25142 Pennywort Terrace
- 25140 Pennywort Terrace
- 25148 Pennywort Terrace
- 25138 Pennywort Terrace
- 25136 Pennywort Terrace
- 25134 Pennywort Terrace
- 25149 Cutgrass Terrace
- 25151 Cutgrass Terrace
- 25147 Cutgrass Terrace
- 25145 Cutgrass Terrace
- 25153 Cutgrass Terrace
- 42039 Bushclover Terrace
- 25143 Cutgrass Terrace
- 25141 Cutgrass Terrace
- 42037 Bushclover Terrace
- 25137 Pennywort Terrace
- 25139 Cutgrass Terrace
- 42035 Bushclover Terrace
- 25135 Pennywort Terrace