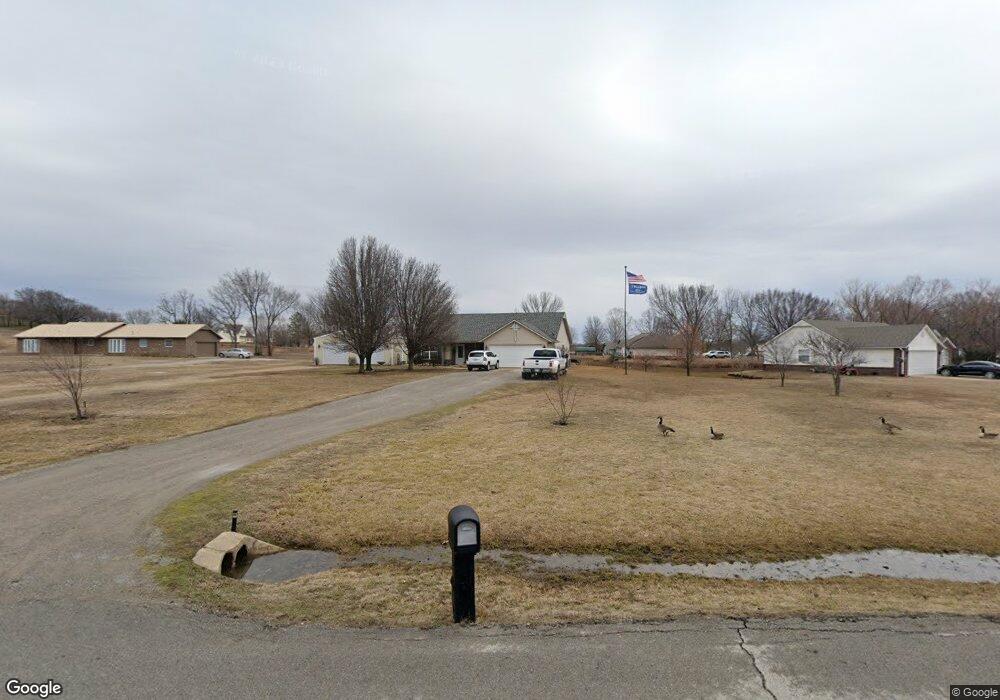
25147 Singletree Ln Claremore, OK 74019
Estimated Value: $225,737 - $283,000
3
Beds
2
Baths
1,366
Sq Ft
$186/Sq Ft
Est. Value
About This Home
This home is located at 25147 Singletree Ln, Claremore, OK 74019 and is currently estimated at $253,684, approximately $185 per square foot. 25147 Singletree Ln is a home located in Rogers County with nearby schools including Justus-Tiawah Public School.
Ownership History
Date
Name
Owned For
Owner Type
Purchase Details
Closed on
Jan 10, 2018
Sold by
Zollo Julie Anna
Bought by
Zollo Julie Anna and Hadden Jack Anthony
Current Estimated Value
Purchase Details
Closed on
Sep 11, 2017
Sold by
Zollo Julie Anna and Spurling Julie Anna
Bought by
Zollo Julie Anna
Home Financials for this Owner
Home Financials are based on the most recent Mortgage that was taken out on this home.
Original Mortgage
$90,000
Outstanding Balance
$48,084
Interest Rate
3.93%
Mortgage Type
New Conventional
Estimated Equity
$205,600
Purchase Details
Closed on
May 12, 2011
Sold by
Spurling Charles Larry
Bought by
Zollo Julie Anna and Spurling Julie Anna
Purchase Details
Closed on
Jan 13, 2003
Sold by
Marinship Joint Venture
Purchase Details
Closed on
Jun 25, 2002
Sold by
York Dick Co-Trustee and Jim Seifrie
Purchase Details
Closed on
Jun 7, 2002
Sold by
York Dick Trustee Of Lyle~& Lela W
Create a Home Valuation Report for This Property
The Home Valuation Report is an in-depth analysis detailing your home's value as well as a comparison with similar homes in the area
Home Values in the Area
Average Home Value in this Area
Purchase History
| Date | Buyer | Sale Price | Title Company |
|---|---|---|---|
| Zollo Julie Anna | -- | None Available | |
| Zollo Julie Anna | -- | Multiple | |
| Zollo Julie Anna | -- | None Available | |
| -- | $120,000 | -- | |
| -- | -- | -- | |
| -- | -- | -- |
Source: Public Records
Mortgage History
| Date | Status | Borrower | Loan Amount |
|---|---|---|---|
| Open | Zollo Julie Anna | $90,000 |
Source: Public Records
Tax History Compared to Growth
Tax History
| Year | Tax Paid | Tax Assessment Tax Assessment Total Assessment is a certain percentage of the fair market value that is determined by local assessors to be the total taxable value of land and additions on the property. | Land | Improvement |
|---|---|---|---|---|
| 2025 | $1,540 | $18,549 | $2,828 | $15,721 |
| 2024 | $1,474 | $17,665 | $2,693 | $14,972 |
| 2023 | $1,474 | $16,824 | $2,200 | $14,624 |
| 2022 | $1,333 | $16,023 | $2,200 | $13,823 |
| 2021 | $1,295 | $15,260 | $2,200 | $13,060 |
| 2020 | $1,284 | $15,161 | $2,200 | $12,961 |
| 2019 | $1,252 | $14,460 | $2,200 | $12,260 |
| 2018 | $1,228 | $14,160 | $2,200 | $11,960 |
| 2017 | $1,224 | $15,013 | $2,200 | $12,813 |
| 2016 | $1,247 | $14,624 | $2,200 | $12,424 |
| 2015 | $1,227 | $14,294 | $2,200 | $12,094 |
| 2014 | $1,230 | $14,337 | $2,200 | $12,137 |
Source: Public Records
Map
Nearby Homes
- 25152 S Hackamore Rd E
- 14155 E 540 Rd
- 15864 E 530 Rd
- 24550 S Meadow Circle Rd
- 23316 S Hwy 88
- 1102 W Lawton Rd
- 23425 S Hooty Creek Rd
- 13549 S Hwy 88
- 13126 E 510 Rd
- 14350 E 510 Rd
- 22677 S Pony Lake Dr Unit A
- 23025 S 4190 Rd
- 11777 E Oak St
- 28255 S 4170 Rd
- 13820 E 500 Rd
- 0 E 540 Unit 2531424
- 3304 Harbour Town
- 6050 E Chestnut
- 0 E 500 Unit 2545008
- 22037 Cliffside
- 25167 Singletree Ln
- 25127 Singletree Ln
- 0 Singletree Ln
- 14403 E Hackamore Rd S
- 25160 Singletree Ln
- 14373 E Hackamore Rd S
- 25140 Singletree Ln
- 25120 Singletree Ln
- 25087 Singletree Ln
- 14415 E Hackamore Rd S
- 25100 Singletree Ln
- 14415 Hackamore Rd E
- 14396 E Hackamore Rd S
- 25067 Singletree Ln
- 14353 E Hackamore Rd S
- 25080 Singletree Ln
- 14406 E Hackamore Rd S
- 14376 E Hackamore Rd S
- 25047 Singletree Ln
- 14416 E Hackamore Rd S