Estimated Value: $215,388 - $269,000
--
Bed
2
Baths
1,147
Sq Ft
$207/Sq Ft
Est. Value
About This Home
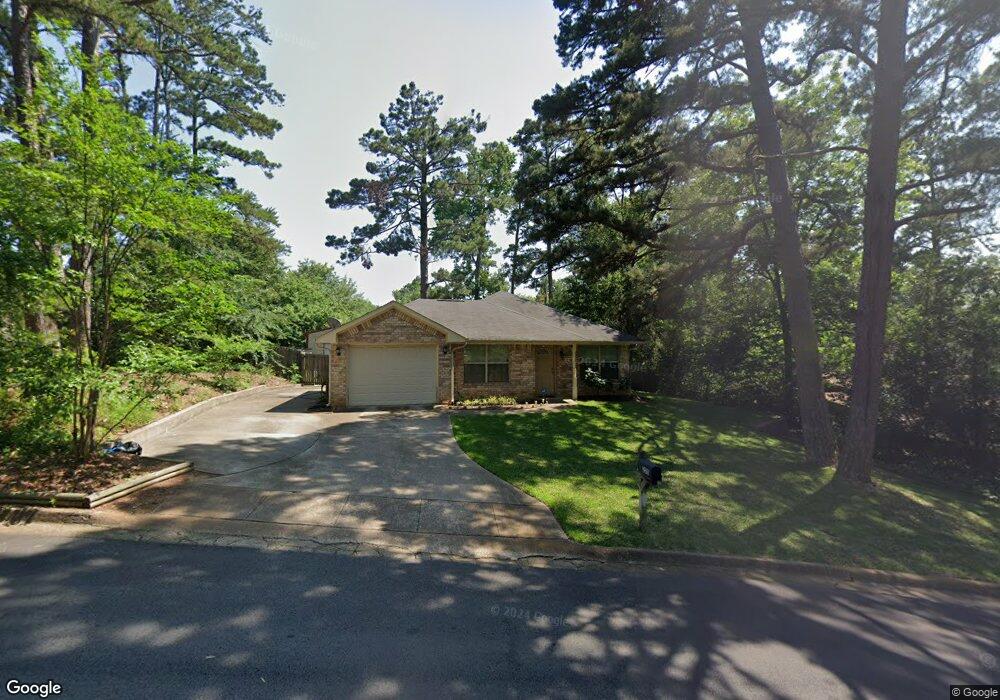
This home is located at 2515 2515 Alta Mira, Tyler, TX 75701 and is currently estimated at $237,347, approximately $206 per square foot. 2515 2515 Alta Mira is a home located in Smith County with nearby schools including Clarkston Elementary School, Hubbard Middle School, and Tyler Legacy High School.
Ownership History
Date
Name
Owned For
Owner Type
Purchase Details
Closed on
Jun 23, 2014
Sold by
Parkhill Clint A
Bought by
Trinh Tien D
Current Estimated Value
Home Financials for this Owner
Home Financials are based on the most recent Mortgage that was taken out on this home.
Original Mortgage
$100,000
Outstanding Balance
$75,926
Interest Rate
4.23%
Mortgage Type
New Conventional
Estimated Equity
$161,421
Purchase Details
Closed on
Oct 29, 2009
Sold by
Glory Builders Inc
Bought by
Parkhill Clint A
Home Financials for this Owner
Home Financials are based on the most recent Mortgage that was taken out on this home.
Original Mortgage
$111,591
Interest Rate
5.05%
Mortgage Type
FHA
Purchase Details
Closed on
May 14, 2009
Sold by
Rve Interests Ltd
Bought by
Glory Builders Inc
Create a Home Valuation Report for This Property
The Home Valuation Report is an in-depth analysis detailing your home's value as well as a comparison with similar homes in the area
Home Values in the Area
Average Home Value in this Area
Purchase History
| Date | Buyer | Sale Price | Title Company |
|---|---|---|---|
| Trinh Tien D | -- | East Texas Title Co | |
| Parkhill Clint A | -- | None Available | |
| Glory Builders Inc | -- | None Available |
Source: Public Records
Mortgage History
| Date | Status | Borrower | Loan Amount |
|---|---|---|---|
| Open | Trinh Tien D | $100,000 | |
| Previous Owner | Parkhill Clint A | $111,591 |
Source: Public Records
Tax History Compared to Growth
Tax History
| Year | Tax Paid | Tax Assessment Tax Assessment Total Assessment is a certain percentage of the fair market value that is determined by local assessors to be the total taxable value of land and additions on the property. | Land | Improvement |
|---|---|---|---|---|
| 2025 | $2,563 | $213,548 | $49,972 | $163,576 |
| 2024 | $2,563 | $207,059 | $42,756 | $165,554 |
| 2023 | $3,281 | $217,012 | $42,756 | $174,256 |
| 2022 | $3,353 | $179,131 | $28,504 | $150,627 |
| 2021 | $3,264 | $155,566 | $20,985 | $134,581 |
| 2020 | $3,309 | $154,656 | $20,985 | $133,671 |
| 2019 | $3,166 | $144,796 | $17,208 | $127,588 |
| 2018 | $2,976 | $136,809 | $13,990 | $122,819 |
| 2017 | $2,921 | $136,809 | $13,990 | $122,819 |
| 2016 | $2,848 | $133,395 | $13,990 | $119,405 |
| 2015 | $2,354 | $128,397 | $13,990 | $114,407 |
| 2014 | $2,354 | $121,764 | $13,990 | $107,774 |
Source: Public Records
Map
Nearby Homes
- 2830 Juniper Ln
- 2512 Alta Mira Dr
- 2226 Mimosa Dr
- 2631 Amy Ln
- 2509 Delmar Dr
- 2716 Royal Village Way
- The Dawson Plan at New Home Living at Medina
- 2949 Medina Dr
- The Hubbard Plan at New Home Living at Medina
- 2014 Miller Dr
- 2026 Neeley St
- 2827 Fairfax Dr
- 3801 Old Troup Hwy
- 2716 Roanoke Ln
- 2002 E Faulkner St
- 2417 Riviera Dr
- 3024 Royal Garden Rd
- 1931 Sterling Dr
- 2126 McDonald Rd
- 1920 McDonald Rd
- 2515 Alta Mira Dr
- 2509 Alta Mira Dr
- 2509 2509 Alta Mira Dr
- 2523 Alta Mira Dr
- 3005 Santa Elena Dr
- 2512 2512 Sheryl
- 2516 Sheryl Ln
- 2512 Sheryl Ln
- 3009 Santa Elena Dr
- 2508 Sheryl Ln
- 2429 Alta Mira Dr
- 2522 Sheryl Ln
- 2522 2522 Sheryl
- 2524 Sheryl Ln
- 3006 Santa Elena Dr
- 2931 Medina Dr
- 2934 Santa Elena Dr
- 3012 Santa Elena Dr
- 2929 2929 Medina
- 2515 2515 Sheryl