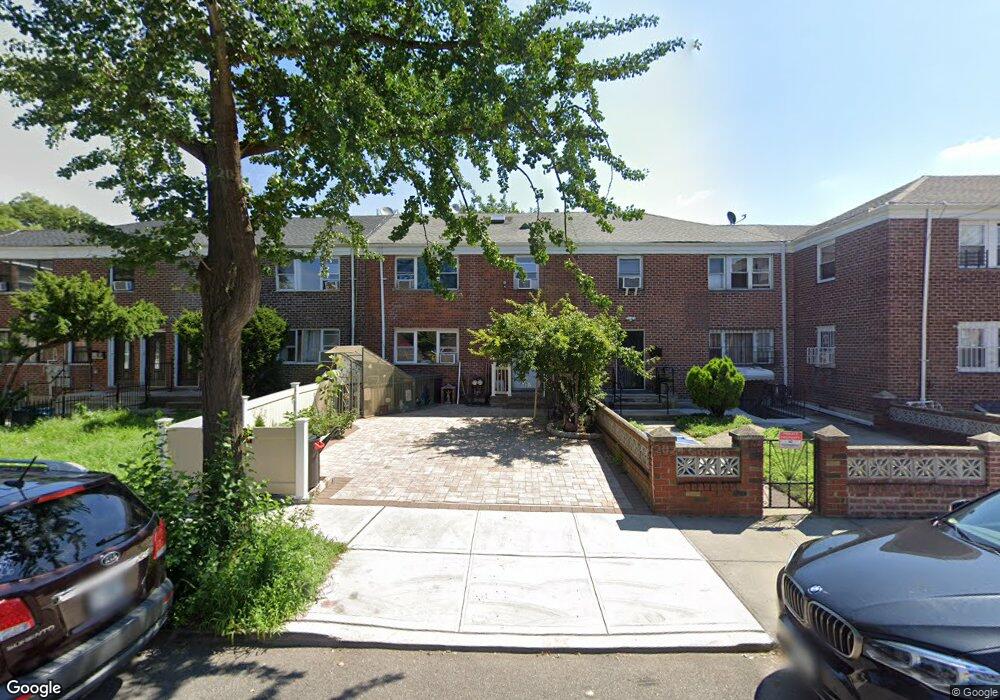
2515 87th St East Elmhurst, NY 11369
Jackson Heights NeighborhoodEstimated Value: $871,335 - $1,065,000
--
Bed
--
Bath
1,250
Sq Ft
$788/Sq Ft
Est. Value
About This Home
This home is located at 2515 87th St, East Elmhurst, NY 11369 and is currently estimated at $984,834, approximately $787 per square foot. 2515 87th St is a home located in Queens County with nearby schools including P.S. 148, I.S. 145 Joseph Pulitzer Magnet School, and Newtown High School.
Ownership History
Date
Name
Owned For
Owner Type
Purchase Details
Closed on
Jun 12, 2012
Sold by
Escamilla Daniel and Espinoza Enedina
Bought by
Espinoza Enedina
Current Estimated Value
Purchase Details
Closed on
Dec 4, 2007
Sold by
Escamilla Daniel
Bought by
Escamilla Daniel and Espinoza Enedina
Home Financials for this Owner
Home Financials are based on the most recent Mortgage that was taken out on this home.
Original Mortgage
$100,000
Interest Rate
6.51%
Purchase Details
Closed on
Oct 3, 2007
Sold by
Avalos Susana
Bought by
Escamilla Daniel
Home Financials for this Owner
Home Financials are based on the most recent Mortgage that was taken out on this home.
Original Mortgage
$100,000
Interest Rate
6.51%
Create a Home Valuation Report for This Property
The Home Valuation Report is an in-depth analysis detailing your home's value as well as a comparison with similar homes in the area
Home Values in the Area
Average Home Value in this Area
Purchase History
| Date | Buyer | Sale Price | Title Company |
|---|---|---|---|
| Espinoza Enedina | $266,925 | -- | |
| Espinoza Enedina | $266,925 | -- | |
| Escamilla Daniel | $266,925 | -- | |
| Escamilla Daniel | $266,925 | -- | |
| Escamilla Daniel | $705,000 | -- | |
| Escamilla Daniel | $705,000 | -- |
Source: Public Records
Mortgage History
| Date | Status | Borrower | Loan Amount |
|---|---|---|---|
| Previous Owner | Escamilla Daniel | $100,000 | |
| Previous Owner | Escamilla Daniel | $533,850 |
Source: Public Records
Tax History Compared to Growth
Tax History
| Year | Tax Paid | Tax Assessment Tax Assessment Total Assessment is a certain percentage of the fair market value that is determined by local assessors to be the total taxable value of land and additions on the property. | Land | Improvement |
|---|---|---|---|---|
| 2025 | $7,542 | $39,802 | $6,375 | $33,427 |
| 2024 | $7,542 | $37,549 | $6,454 | $31,095 |
| 2023 | $7,115 | $35,424 | $6,696 | $28,728 |
| 2022 | $6,755 | $49,380 | $8,880 | $40,500 |
| 2021 | $7,122 | $44,400 | $8,880 | $35,520 |
| 2020 | $7,021 | $42,540 | $8,880 | $33,660 |
| 2019 | $6,546 | $46,860 | $8,880 | $37,980 |
| 2018 | $6,018 | $29,520 | $5,414 | $24,106 |
| 2017 | $5,749 | $28,200 | $6,183 | $22,017 |
| 2016 | $5,637 | $28,200 | $6,183 | $22,017 |
| 2015 | $3,209 | $27,640 | $7,762 | $19,878 |
| 2014 | $3,209 | $26,076 | $8,781 | $17,295 |
Source: Public Records
Map
Nearby Homes