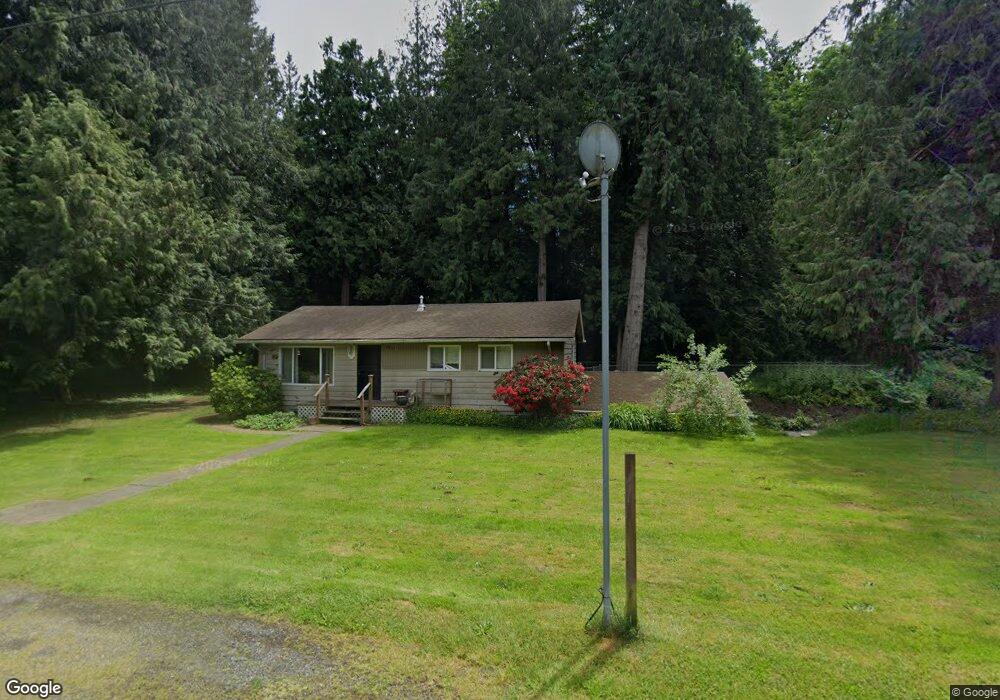
2515 Central Rd Everson, WA 98247
Estimated Value: $460,313 - $586,000
3
Beds
2
Baths
1,920
Sq Ft
$268/Sq Ft
Est. Value
About This Home
This home is located at 2515 Central Rd, Everson, WA 98247 and is currently estimated at $514,078, approximately $267 per square foot. 2515 Central Rd is a home located in Whatcom County with nearby schools including Everson Elementary School, Nooksack Elementary School, and Sumas Elementary School.
Ownership History
Date
Name
Owned For
Owner Type
Purchase Details
Closed on
Feb 1, 2017
Sold by
Heinlen Dianne Fern and Kisselburg James Howard
Bought by
Kisselburg James Howard
Current Estimated Value
Purchase Details
Closed on
Jun 28, 2007
Sold by
Marcoff Clarence C and Marcoff Angela L
Bought by
Kisselburg James and Kisselburg Dianne
Home Financials for this Owner
Home Financials are based on the most recent Mortgage that was taken out on this home.
Original Mortgage
$10,000
Outstanding Balance
$4,209
Interest Rate
6.21%
Mortgage Type
Stand Alone Second
Estimated Equity
$509,869
Create a Home Valuation Report for This Property
The Home Valuation Report is an in-depth analysis detailing your home's value as well as a comparison with similar homes in the area
Purchase History
| Date | Buyer | Sale Price | Title Company |
|---|---|---|---|
| Kisselburg James Howard | -- | None Available | |
| Kisselburg James | $298,280 | Chicago Title Insurance |
Source: Public Records
Mortgage History
| Date | Status | Borrower | Loan Amount |
|---|---|---|---|
| Open | Kisselburg James | $10,000 | |
| Open | Kisselburg James | $238,400 |
Source: Public Records
Tax History
| Year | Tax Paid | Tax Assessment Tax Assessment Total Assessment is a certain percentage of the fair market value that is determined by local assessors to be the total taxable value of land and additions on the property. | Land | Improvement |
|---|---|---|---|---|
| 2025 | $4,130 | $473,661 | $254,100 | $219,561 |
| 2024 | $3,523 | $445,206 | $231,000 | $214,206 |
| 2023 | $3,523 | $397,772 | $172,180 | $225,592 |
| 2022 | $3,291 | $358,360 | $155,120 | $203,240 |
| 2021 | $3,028 | $296,169 | $128,200 | $167,969 |
| 2020 | $2,919 | $240,793 | $104,230 | $136,563 |
| 2019 | $2,479 | $240,793 | $104,230 | $136,563 |
| 2018 | $3,285 | $231,021 | $100,000 | $131,021 |
| 2017 | $2,927 | $230,181 | $92,800 | $137,381 |
| 2016 | $2,805 | $212,395 | $85,600 | $126,795 |
| 2015 | $2,395 | $203,945 | $82,560 | $121,385 |
| 2014 | -- | $197,621 | $80,000 | $117,621 |
| 2013 | -- | $197,621 | $80,000 | $117,621 |
Source: Public Records
Map
Nearby Homes
- 2495 River Rock Dr
- 1817 Central Rd
- 809 Pine Crest Dr
- 800 Cedar Dr
- 5818 Everson Goshen Rd
- 1302 Night Hawk Way
- 3090 Cole Rd
- 1203 Red Tail Ct
- 1822 E Pole Rd
- 1005 Night Hawk Way
- 3395 Mack Rd
- 3037 Massey Rd
- 616 Strandell St
- 5544 Sand Rd
- 2200 E Smith Rd
- 107 River St
- 0 Walnut Grove Ct
- 1375 Ten Mile Rd
- 1383 Ten Mile Rd
- 7554 Nooksack Rd
- 6472 Mission Rd
- 6545 Mission Rd
- 2454 Central Rd
- 6455 Mission Rd
- 6573 Mission Rd
- 2569 Central Rd
- 2435 Central Rd
- 6416 Mission Rd
- 6561 Mission Rd
- 6597 Mission Rd
- 6416 Lidhran Ln
- 6412 Lidhran Ln
- 2410 Central Rd
- 2490 Woodhaven Dr
- 6344 Mission Rd
- 6613 Mission Rd
- 6408 Lidhran Ln
- 2389 Central Rd
- 6621 Mission Rd
- 2633 Central Rd
Your Personal Tour Guide
Ask me questions while you tour the home.