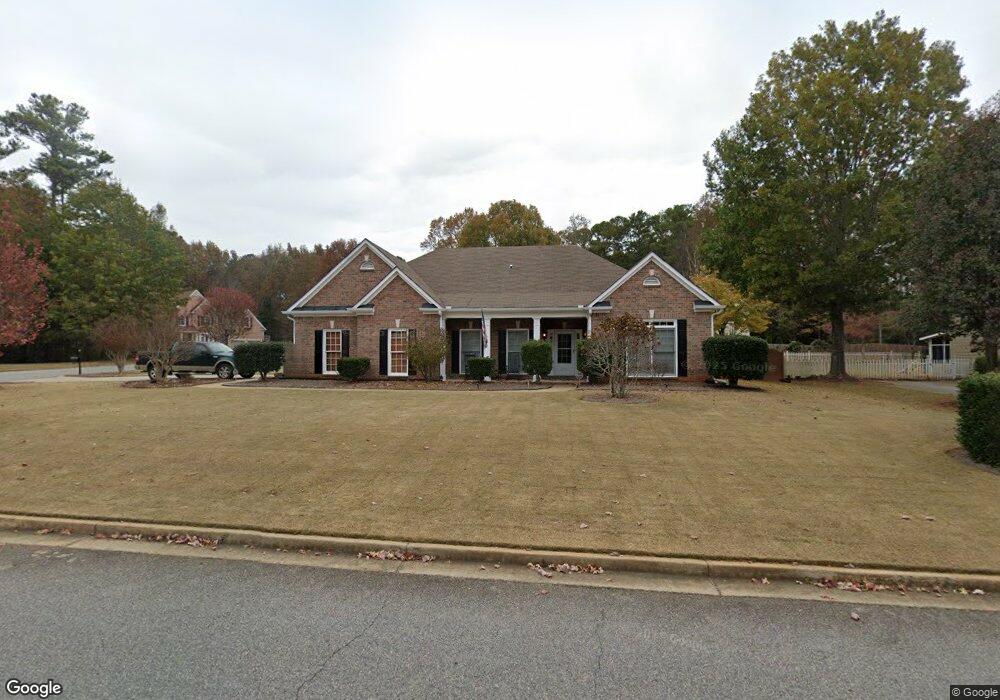
2515 Clairview St Alpharetta, GA 30009
Estimated Value: $734,000 - $850,000
3
Beds
3
Baths
2,339
Sq Ft
$332/Sq Ft
Est. Value
About This Home
This home is located at 2515 Clairview St, Alpharetta, GA 30009 and is currently estimated at $777,114, approximately $332 per square foot. 2515 Clairview St is a home located in Fulton County with nearby schools including Manning Oaks Elementary School, Hopewell Middle School, and Alpharetta High School.
Ownership History
Date
Name
Owned For
Owner Type
Purchase Details
Closed on
Feb 24, 2009
Sold by
Fremont Trust 2006 & A
Bought by
Knapik Steven J and Knapik Agathi B
Current Estimated Value
Purchase Details
Closed on
Jul 1, 2008
Sold by
Mortgage Electronic Registrati
Bought by
Fremont Trust 2006 & A
Purchase Details
Closed on
Apr 2, 2007
Sold by
Edwards Fannie
Bought by
Young Geraldine
Purchase Details
Closed on
Dec 1, 2006
Sold by
Edwards George
Bought by
Edwards Fannie
Purchase Details
Closed on
Sep 30, 1999
Sold by
Mccar Dev Corp
Bought by
Rumley Cheree N
Home Financials for this Owner
Home Financials are based on the most recent Mortgage that was taken out on this home.
Original Mortgage
$209,000
Interest Rate
7.85%
Mortgage Type
New Conventional
Create a Home Valuation Report for This Property
The Home Valuation Report is an in-depth analysis detailing your home's value as well as a comparison with similar homes in the area
Home Values in the Area
Average Home Value in this Area
Purchase History
| Date | Buyer | Sale Price | Title Company |
|---|---|---|---|
| Knapik Steven J | $235,000 | -- | |
| Fremont Trust 2006 & A | -- | -- | |
| Mortgage Electronic Registrati | $287,916 | -- | |
| Young Geraldine | $10,000 | -- | |
| Edwards Fannie | $10,000 | -- | |
| Rumley Cheree N | $223,000 | -- |
Source: Public Records
Mortgage History
| Date | Status | Borrower | Loan Amount |
|---|---|---|---|
| Previous Owner | Rumley Cheree N | $209,000 |
Source: Public Records
Tax History Compared to Growth
Tax History
| Year | Tax Paid | Tax Assessment Tax Assessment Total Assessment is a certain percentage of the fair market value that is determined by local assessors to be the total taxable value of land and additions on the property. | Land | Improvement |
|---|---|---|---|---|
| 2025 | $1,155 | $310,840 | $67,720 | $243,120 |
| 2023 | $6,774 | $240,000 | $33,200 | $206,800 |
| 2022 | $5,241 | $255,640 | $33,200 | $222,440 |
| 2021 | $6,550 | $199,200 | $31,240 | $167,960 |
| 2020 | $5,952 | $177,440 | $34,760 | $142,680 |
| 2019 | $1,002 | $174,280 | $34,120 | $140,160 |
| 2018 | $4,179 | $148,040 | $33,320 | $114,720 |
| 2017 | $3,794 | $130,040 | $24,120 | $105,920 |
| 2016 | $3,795 | $130,040 | $24,120 | $105,920 |
| 2015 | $4,558 | $130,040 | $24,120 | $105,920 |
| 2014 | $3,215 | $104,880 | $23,840 | $81,040 |
Source: Public Records
Map
Nearby Homes
- 161 Red Oak Ln
- 221 Academy St
- Lot 7 Plan at 1858 Downtown
- Lot 9 Plan at 1858 Downtown
- 105 Martin Run
- 154 Cold Creek Dr
- 12350 Clairmonte Ave
- 355 Cricket Ln
- 126 Academy St
- 122 Academy St
- 2600 Milford Ln
- 2540 Milford Ln
- 105 Cumming St
- 12120 Dancliff Trace
- 12225 Clairmonte Ave
- 2555 Milford Ln
- 138 Sterling Ct
- 208 Wade Creek Rd
- 136 Sterling Ct
- 2505 Clairview St
- 12165 Clairmeade Trail
- 2525 Clairview St
- 2580 Clairview St
- 2570 Clairview St
- 2590 Clairview St
- 2590 Clairview St Unit 2590
- 2495 Clairview St
- 12160 Clairmeade Trail
- 1085 Clairborne Dr
- 12170 Clairmeade Trail
- 2535 Clairview St
- 2600 Clairview St
- 2560 Clairview St
- 1075 Clairborne Dr
- 0 Clairview St Unit 3286837
- 0 Clairview St Unit 7010849
- 0 Clairview St Unit 7474655
- 0 Clairview St Unit 7079768
- 0 Clairview St Unit 8146738