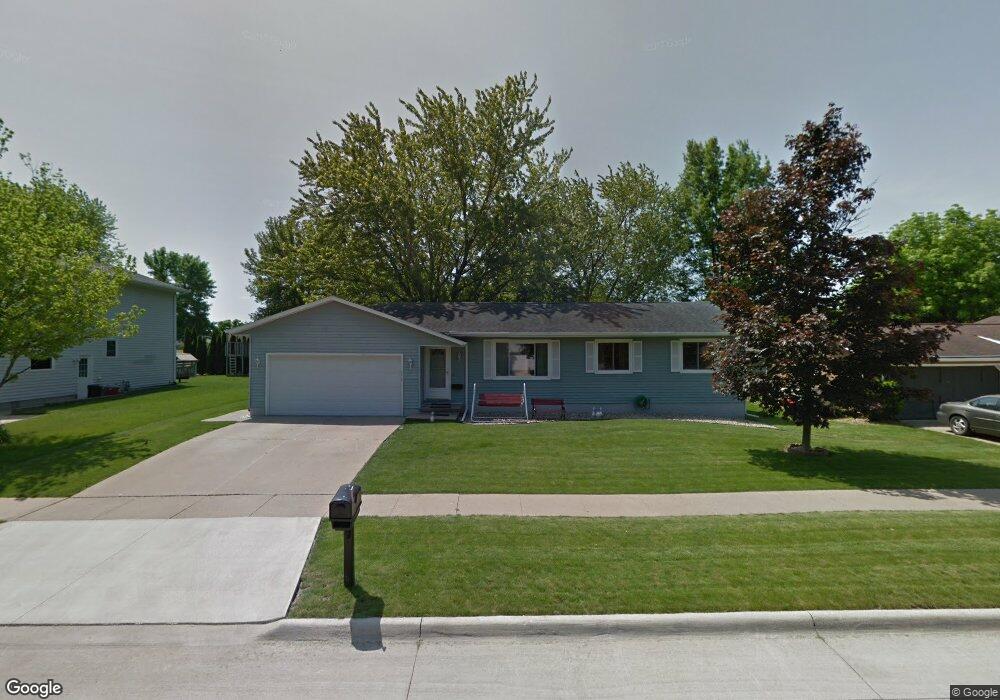
2515 Clark Ave Marion, IA 52302
Estimated Value: $228,560 - $275,000
3
Beds
3
Baths
1,332
Sq Ft
$187/Sq Ft
Est. Value
About This Home
This home is located at 2515 Clark Ave, Marion, IA 52302 and is currently estimated at $249,390, approximately $187 per square foot. 2515 Clark Ave is a home located in Linn County with nearby schools including Francis Marion Intermediate School, Vernon Middle School, and Marion High School.
Ownership History
Date
Name
Owned For
Owner Type
Purchase Details
Closed on
Sep 25, 2000
Sold by
Robinson Jerry and Robinson Linda
Bought by
Robinson Jerry and Robinson Linda
Current Estimated Value
Purchase Details
Closed on
May 5, 2000
Sold by
Lawless Cecil L and Lawless Mary C
Bought by
Robinson Jerry L and Robinson Linda K
Home Financials for this Owner
Home Financials are based on the most recent Mortgage that was taken out on this home.
Original Mortgage
$104,000
Outstanding Balance
$36,369
Interest Rate
8.31%
Estimated Equity
$213,021
Create a Home Valuation Report for This Property
The Home Valuation Report is an in-depth analysis detailing your home's value as well as a comparison with similar homes in the area
Home Values in the Area
Average Home Value in this Area
Purchase History
| Date | Buyer | Sale Price | Title Company |
|---|---|---|---|
| Robinson Jerry | $24,000 | -- | |
| Robinson Jerry L | $133,500 | -- |
Source: Public Records
Mortgage History
| Date | Status | Borrower | Loan Amount |
|---|---|---|---|
| Open | Robinson Jerry L | $104,000 |
Source: Public Records
Tax History
| Year | Tax Paid | Tax Assessment Tax Assessment Total Assessment is a certain percentage of the fair market value that is determined by local assessors to be the total taxable value of land and additions on the property. | Land | Improvement |
|---|---|---|---|---|
| 2025 | $3,276 | $241,200 | $27,700 | $213,500 |
| 2024 | $3,864 | $192,000 | $27,700 | $164,300 |
| 2023 | $3,864 | $192,000 | $27,700 | $164,300 |
| 2022 | $3,730 | $182,500 | $27,700 | $154,800 |
| 2021 | $3,684 | $182,500 | $27,700 | $154,800 |
| 2020 | $3,684 | $171,600 | $27,700 | $143,900 |
| 2019 | $3,400 | $159,400 | $27,700 | $131,700 |
Source: Public Records
Map
Nearby Homes
Your Personal Tour Guide
Ask me questions while you tour the home.