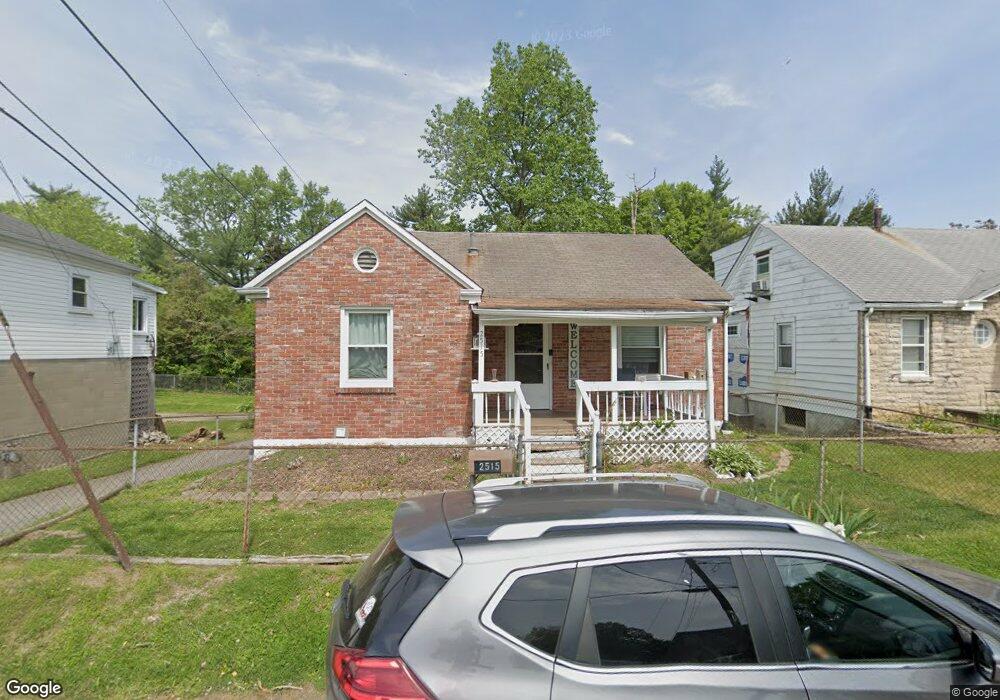
2515 E Oak St New Albany, IN 47150
Estimated Value: $144,227 - $224,000
2
Beds
2
Baths
1,500
Sq Ft
$124/Sq Ft
Est. Value
About This Home
This home is located at 2515 E Oak St, New Albany, IN 47150 and is currently estimated at $186,057, approximately $124 per square foot. 2515 E Oak St is a home located in Floyd County with nearby schools including Slate Run Elementary School, Hazelwood Middle School, and New Albany Senior High School.
Ownership History
Date
Name
Owned For
Owner Type
Purchase Details
Closed on
Feb 21, 2018
Sold by
Gregory Joshua and Gregory Celia
Bought by
Gregory Dev Llc
Current Estimated Value
Purchase Details
Closed on
Oct 17, 2008
Sold by
Gregory Joshua D
Bought by
Gregory Joshua D and Gregory Celia
Home Financials for this Owner
Home Financials are based on the most recent Mortgage that was taken out on this home.
Original Mortgage
$60,000
Interest Rate
6.41%
Mortgage Type
New Conventional
Purchase Details
Closed on
May 30, 2008
Sold by
Gregory Daniel R
Bought by
Gregory Joshua D
Purchase Details
Closed on
Feb 20, 2008
Sold by
Deutsche Bank National Trust Company
Bought by
Gregory Dan
Purchase Details
Closed on
Feb 19, 2008
Sold by
Harbeson Gary Charles and Harbescon Rebecca Lynn
Bought by
Deutsche Bank National Trust Company
Create a Home Valuation Report for This Property
The Home Valuation Report is an in-depth analysis detailing your home's value as well as a comparison with similar homes in the area
Home Values in the Area
Average Home Value in this Area
Purchase History
| Date | Buyer | Sale Price | Title Company |
|---|---|---|---|
| Gregory Dev Llc | -- | -- | |
| Gregory Dev Llc | -- | -- | |
| Gregory Joshua D | -- | None Available | |
| Gregory Joshua D | -- | None Available | |
| Gregory Dan | -- | None Available | |
| Deutsche Bank National Trust Company | $34,930 | None Available |
Source: Public Records
Mortgage History
| Date | Status | Borrower | Loan Amount |
|---|---|---|---|
| Previous Owner | Gregory Joshua D | $60,000 |
Source: Public Records
Tax History Compared to Growth
Tax History
| Year | Tax Paid | Tax Assessment Tax Assessment Total Assessment is a certain percentage of the fair market value that is determined by local assessors to be the total taxable value of land and additions on the property. | Land | Improvement |
|---|---|---|---|---|
| 2024 | $1,952 | $91,900 | $12,900 | $79,000 |
| 2023 | $1,767 | $115,000 | $12,900 | $102,100 |
| 2022 | $2,305 | $107,500 | $12,900 | $94,600 |
| 2021 | $2,135 | $98,800 | $12,900 | $85,900 |
| 2020 | $2,049 | $94,700 | $12,900 | $81,800 |
| 2019 | $1,878 | $86,800 | $12,900 | $73,900 |
| 2018 | $1,892 | $86,000 | $12,900 | $73,100 |
| 2017 | $1,726 | $77,900 | $12,900 | $65,000 |
| 2016 | $1,552 | $77,300 | $12,900 | $64,400 |
| 2014 | $1,851 | $71,800 | $12,800 | $59,000 |
| 2013 | -- | $76,100 | $12,900 | $63,200 |
Source: Public Records
Map
Nearby Homes
- 916 Korb Ave
- 2231 E Oak St
- 1578 Clifton Ave
- 2303 Mclean Ave
- 2131 Culbertson Ave
- 2124 E Oak St
- 1413 Silver Slate Dr
- 2219 Reno Ave
- 2216 Morton Ave
- 2215 Reno Ave
- 1651 Summit Ave
- 2119 Reno Ave
- 13 Bellewood Ct
- 1655 Harriett Ct
- 2107 E Market St
- 1408 Gutford Rd
- 1435 Bellemeade Dr
- 2024 E Market St
- 237 Silver St
- 1935 Center St
- 2517 E Oak St
- 2519 E Oak St
- 2521 E Oak St
- 604 Beharrell Ave
- 2520 E Oak St
- 2523 E Oak St
- 550 Beharrell Ave
- 2522 E Oak St
- 606 Beharrell Ave Unit 608
- 2524 E Oak St
- 2527 E Oak St
- 542 Beharrell Ave
- 614 Beharrell Ave
- 538 Beharrell Ave
- 2529 E Oak St
- 2519 E Elm St
- 2528 E Oak St
- 2517 E Elm St
- 607 Beharrell Ave
- 605 Beharrell Ave