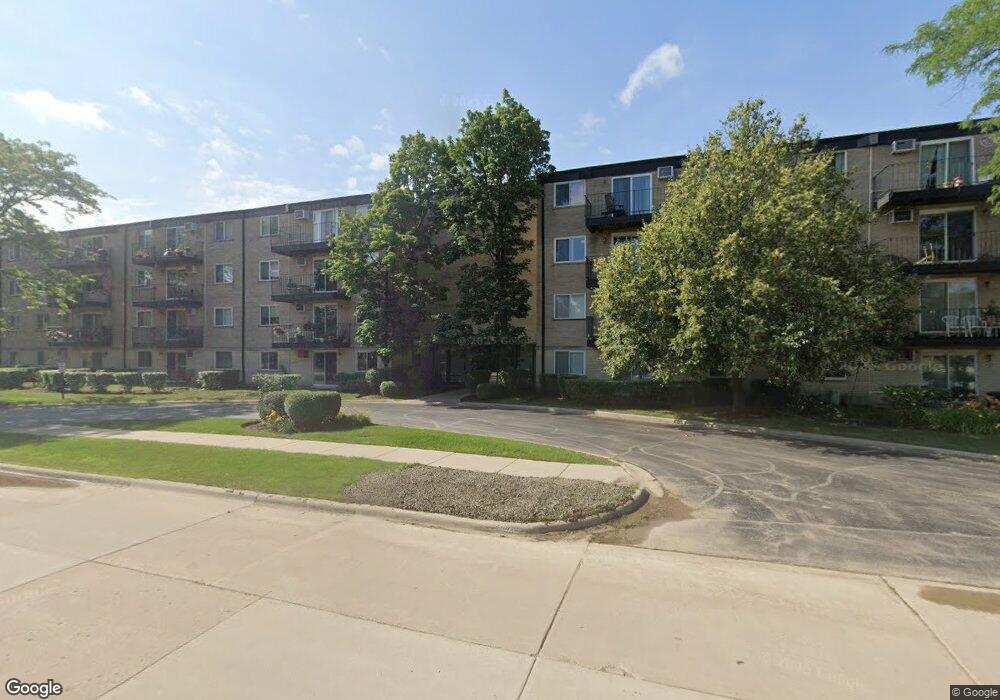
2515 E Olive St Unit 71I Arlington Heights, IL 60004
Estimated Value: $156,000 - $171,732
1
Bed
--
Bath
800
Sq Ft
$206/Sq Ft
Est. Value
About This Home
This home is located at 2515 E Olive St Unit 71I, Arlington Heights, IL 60004 and is currently estimated at $165,183, approximately $206 per square foot. 2515 E Olive St Unit 71I is a home located in Cook County with nearby schools including Dwight D Eisenhower Elementary School, Anne Sullivan Elementary School, and Betsy Ross Elementary School.
Ownership History
Date
Name
Owned For
Owner Type
Purchase Details
Closed on
Apr 24, 2024
Sold by
Flanagan Kathleen
Bought by
Kathleenflanagan Trust and Flanagan
Current Estimated Value
Purchase Details
Closed on
May 24, 2021
Sold by
Leff Cathryn A and Conrad R Campe Trust
Bought by
Flanagan Kathleen
Home Financials for this Owner
Home Financials are based on the most recent Mortgage that was taken out on this home.
Original Mortgage
$104,000
Interest Rate
2.9%
Mortgage Type
VA
Purchase Details
Closed on
Dec 15, 2011
Sold by
Leff Cathryn A
Bought by
Leff Cathryn A and Conrad R Campe Trust
Purchase Details
Closed on
Nov 8, 2007
Sold by
Campe Conrad R
Bought by
Campe Conrad R
Purchase Details
Closed on
Aug 5, 1999
Sold by
Schutte Susan W
Bought by
Campe Conrad R and Campe Virginia
Create a Home Valuation Report for This Property
The Home Valuation Report is an in-depth analysis detailing your home's value as well as a comparison with similar homes in the area
Home Values in the Area
Average Home Value in this Area
Purchase History
| Date | Buyer | Sale Price | Title Company |
|---|---|---|---|
| Kathleenflanagan Trust | -- | None Listed On Document | |
| Kathleenflanagan Trust | -- | None Listed On Document | |
| Flanagan Kathleen | $104,000 | Fidelity National Title | |
| Leff Cathryn A | -- | None Available | |
| Campe Conrad R | -- | None Available | |
| Campe Conrad R | $75,000 | 1St American Title |
Source: Public Records
Mortgage History
| Date | Status | Borrower | Loan Amount |
|---|---|---|---|
| Previous Owner | Flanagan Kathleen | $104,000 |
Source: Public Records
Tax History Compared to Growth
Tax History
| Year | Tax Paid | Tax Assessment Tax Assessment Total Assessment is a certain percentage of the fair market value that is determined by local assessors to be the total taxable value of land and additions on the property. | Land | Improvement |
|---|---|---|---|---|
| 2024 | $2,744 | $10,040 | $926 | $9,114 |
| 2023 | $2,620 | $10,040 | $926 | $9,114 |
| 2022 | $2,620 | $10,040 | $926 | $9,114 |
| 2021 | $567 | $5,197 | $289 | $4,908 |
| 2020 | $620 | $5,197 | $289 | $4,908 |
| 2019 | $631 | $5,816 | $289 | $5,527 |
| 2018 | $549 | $5,321 | $231 | $5,090 |
| 2017 | $561 | $5,321 | $231 | $5,090 |
| 2016 | $758 | $5,321 | $231 | $5,090 |
| 2015 | $582 | $4,582 | $578 | $4,004 |
| 2014 | $591 | $4,582 | $578 | $4,004 |
| 2013 | $560 | $4,582 | $578 | $4,004 |
Source: Public Records
Map
Nearby Homes
- 2420 E Brandenberry Ct Unit 1K
- 2424 E Oakton St Unit 3C
- 2315 E Olive St Unit 3G
- 2315 E Olive St Unit 2G
- 2431 E Brandenberry Ct Unit 2O
- 1215 N Waterman Ave Unit 3L
- 2443 E Brandenberry Ct Unit 1B
- 2443 E Brandenberry Ct Unit 2A
- 2403 E Brandenberry Ct Unit 2A
- 1404 Apple Ct Unit A
- 2611 E Radford Ct
- 1401 Plum Ct Unit D
- 1311 Nutmeg Ct Unit A
- 1405 Apricot Ct Unit D
- 802 Butternut Ln Unit C
- 1101 N Stratford Rd
- 1504 E Olive St
- 1532 N Courtland Dr Unit 6
- 211 W Hanover Place Unit T85
- 1428 N Bridgeport Dr Unit T37
- 2515 E Olive St Unit 1C
- 2515 E Olive St Unit 2K
- 2515 E Olive St Unit 3I
- 2515 E Olive St Unit 72K
- 2515 E Olive St Unit 73H
- 2515 E Olive St Unit 71L
- 2515 E Olive St Unit 74D
- 2515 E Olive St Unit 73K
- 2515 E Olive St Unit 73I
- 2515 E Olive St Unit 72J
- 2515 E Olive St Unit 72I
- 2515 E Olive St Unit 72E
- 2515 E Olive St Unit 72D
- 2515 E Olive St Unit 72C
- 2515 E Olive St Unit 71K
- 2515 E Olive St Unit 71E
- 2515 E Olive St Unit 74H
- 2515 E Olive St Unit 71G
- 2515 E Olive St Unit 72L
- 2515 E Olive St Unit 72H