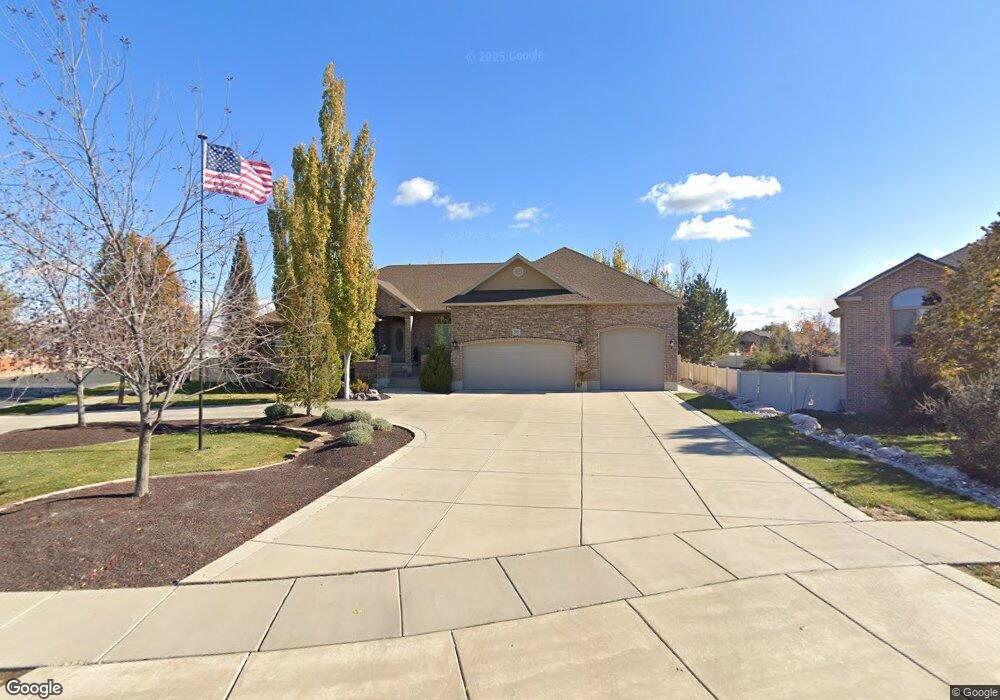
2515 S 2050 W Unit 113 Syracuse, UT 84075
Estimated Value: $628,000 - $775,909
5
Beds
3
Baths
3,982
Sq Ft
$182/Sq Ft
Est. Value
About This Home
This home is located at 2515 S 2050 W Unit 113, Syracuse, UT 84075 and is currently estimated at $724,477, approximately $181 per square foot. 2515 S 2050 W Unit 113 is a home located in Davis County with nearby schools including Syracuse Elementary School, Syracuse Junior High School, and Syracuse High School.
Ownership History
Date
Name
Owned For
Owner Type
Purchase Details
Closed on
May 31, 2024
Sold by
Douglas Anna M
Bought by
Pardo Pablo A
Current Estimated Value
Home Financials for this Owner
Home Financials are based on the most recent Mortgage that was taken out on this home.
Original Mortgage
$610,000
Outstanding Balance
$601,798
Interest Rate
7.1%
Mortgage Type
New Conventional
Estimated Equity
$122,679
Purchase Details
Closed on
Sep 7, 2005
Sold by
Kendall Homes Inc
Bought by
Douglas John M and Douglas Anna M
Home Financials for this Owner
Home Financials are based on the most recent Mortgage that was taken out on this home.
Original Mortgage
$316,000
Interest Rate
5.7%
Mortgage Type
Fannie Mae Freddie Mac
Purchase Details
Closed on
Sep 29, 2003
Sold by
Scott Baker Construction Inc
Bought by
Kendall Homes Inc
Create a Home Valuation Report for This Property
The Home Valuation Report is an in-depth analysis detailing your home's value as well as a comparison with similar homes in the area
Home Values in the Area
Average Home Value in this Area
Purchase History
| Date | Buyer | Sale Price | Title Company |
|---|---|---|---|
| Pardo Pablo A | -- | Us Title | |
| Douglas John M | -- | Founders Title Co | |
| Kendall Homes Inc | -- | Bonneville Title Company Inc |
Source: Public Records
Mortgage History
| Date | Status | Borrower | Loan Amount |
|---|---|---|---|
| Open | Pardo Pablo A | $610,000 | |
| Previous Owner | Douglas John M | $316,000 |
Source: Public Records
Tax History Compared to Growth
Tax History
| Year | Tax Paid | Tax Assessment Tax Assessment Total Assessment is a certain percentage of the fair market value that is determined by local assessors to be the total taxable value of land and additions on the property. | Land | Improvement |
|---|---|---|---|---|
| 2025 | $4,401 | $424,600 | $127,613 | $296,987 |
| 2024 | $4,003 | $388,850 | $114,686 | $274,164 |
| 2023 | $3,763 | $666,000 | $159,256 | $506,744 |
| 2022 | $3,973 | $385,550 | $90,379 | $295,171 |
| 2021 | $3,442 | $517,000 | $134,629 | $382,371 |
| 2020 | $3,074 | $447,000 | $112,634 | $334,366 |
| 2019 | $3,030 | $435,000 | $115,799 | $319,201 |
| 2018 | $2,821 | $402,000 | $108,738 | $293,262 |
| 2016 | $2,605 | $194,645 | $41,527 | $153,118 |
| 2015 | $2,859 | $203,500 | $41,527 | $161,973 |
| 2014 | $2,516 | $182,474 | $41,527 | $140,947 |
| 2013 | -- | $168,865 | $37,831 | $131,034 |
Source: Public Records
Map
Nearby Homes
- 2208 W 2615 S Unit 141
- 2198 W 2615 S Unit 140
- 2158 W 2615 S Unit 137
- 2650 S 2000 W
- 2503 S 1875 W
- 1836 W 2400 S
- 2104 W 2200 S
- 2136 W 2200 S
- 2194 S 1800 W
- 1697 W 2770 S Unit 202
- 2402 W 2700 S
- 1695 W 2770 S Unit 203
- 1806 Park Dr
- 1667 W 2770 S Unit 206
- Bridgeport Plan at Sadie's Glenn
- Sullivan Plan at Sadie's Glenn
- Ashmore Plan at Sadie's Glenn
- Havenwood Plan at Sadie's Glenn
- Bradford Plan at Sadie's Glenn
- Sadie's Glen Plan at Sadie's Glenn