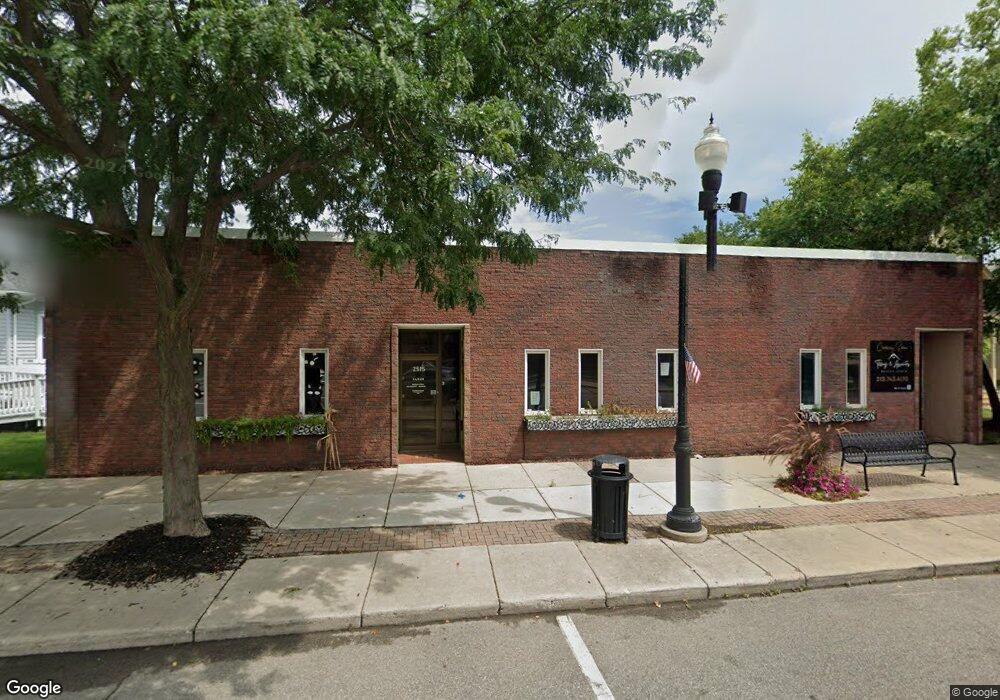
2515 W Jefferson Ave Trenton, MI 48183
Estimated Value: $306,798
--
Bed
--
Bath
6,341
Sq Ft
$48/Sq Ft
Est. Value
About This Home
This home is located at 2515 W Jefferson Ave, Trenton, MI 48183 and is currently estimated at $306,798, approximately $48 per square foot. 2515 W Jefferson Ave is a home located in Wayne County with nearby schools including Jesse L. Anderson Elementary School, Boyd W. Arthurs Middle School, and Trenton High School.
Ownership History
Date
Name
Owned For
Owner Type
Purchase Details
Closed on
May 14, 2024
Sold by
Fur Real Properties Llc
Bought by
Tillery Properties Llc
Current Estimated Value
Home Financials for this Owner
Home Financials are based on the most recent Mortgage that was taken out on this home.
Original Mortgage
$240,000
Outstanding Balance
$183,754
Interest Rate
6.82%
Mortgage Type
New Conventional
Estimated Equity
$123,044
Purchase Details
Closed on
Apr 23, 2018
Sold by
Comerica Bank
Bought by
Fur Real Properties Llc
Home Financials for this Owner
Home Financials are based on the most recent Mortgage that was taken out on this home.
Original Mortgage
$153,000
Interest Rate
4.45%
Mortgage Type
Commercial
Purchase Details
Closed on
Jan 10, 2018
Sold by
Bo Bo Development Co
Bought by
Comerica Bank
Purchase Details
Closed on
Jan 28, 2004
Sold by
Witucki Michael and Witucki Kathleen
Bought by
Bo Bo Development Co
Purchase Details
Closed on
Aug 3, 2001
Sold by
Payton Sonia
Bought by
Witucki Kathleen
Create a Home Valuation Report for This Property
The Home Valuation Report is an in-depth analysis detailing your home's value as well as a comparison with similar homes in the area
Home Values in the Area
Average Home Value in this Area
Purchase History
| Date | Buyer | Sale Price | Title Company |
|---|---|---|---|
| Tillery Properties Llc | $300,000 | Ata National Title | |
| Tillery Properties Llc | $300,000 | Ata National Title | |
| Fur Real Properties Llc | $170,000 | First American Title | |
| Comerica Bank | -- | None Available | |
| Bo Bo Development Co | -- | Lawyers Title Insurance Co | |
| Witucki Kathleen | $152,000 | -- |
Source: Public Records
Mortgage History
| Date | Status | Borrower | Loan Amount |
|---|---|---|---|
| Open | Tillery Properties Llc | $240,000 | |
| Closed | Tillery Properties Llc | $240,000 | |
| Previous Owner | Fur Real Properties Llc | $153,000 |
Source: Public Records
Tax History Compared to Growth
Tax History
| Year | Tax Paid | Tax Assessment Tax Assessment Total Assessment is a certain percentage of the fair market value that is determined by local assessors to be the total taxable value of land and additions on the property. | Land | Improvement |
|---|---|---|---|---|
| 2025 | $5,535 | $132,600 | $0 | $0 |
| 2024 | $5,535 | $126,800 | $0 | $0 |
| 2023 | $5,094 | $118,000 | $0 | $0 |
| 2022 | $7,481 | $110,100 | $0 | $0 |
| 2021 | $7,153 | $97,700 | $0 | $0 |
| 2020 | $7,058 | $96,900 | $0 | $0 |
| 2019 | $6,926 | $92,400 | $0 | $0 |
| 2018 | $4,133 | $102,000 | $0 | $0 |
| 2017 | $4,248 | $98,600 | $0 | $0 |
| 2016 | $5,935 | $93,600 | $0 | $0 |
| 2015 | $8,341 | $84,000 | $0 | $0 |
| 2013 | $8,290 | $85,400 | $0 | $0 |
| 2012 | $5,420 | $82,600 | $6,200 | $76,400 |
Source: Public Records
Map
Nearby Homes
- 2767 Riverside Dr
- 2617 4th St
- 2445 Riverside Dr Unit 206
- 2744 Riverside Dr Unit 17
- 2419 Riverside Dr Unit 208
- 417 Saint Joseph St
- 2848 4th St
- 2850 5th St
- 2931 4th St
- 2161 3rd St
- 1225 Harbour Dr Unit 28
- 3437 3rd St Unit G
- 1935 Church Place
- 22241 Miami Dr
- 2100 Fort St
- 2330 Cambridge St
- 2610 Gorno St
- 1900 Fort St Unit 3
- 1870 Fort St Unit 1
- 2657 Chelsea St
- 2531 W Jefferson Ave
- 2505 W Jefferson Ave
- 2545 W Jefferson Ave
- 2518 Riverside Dr
- 2506 Riverside Dr Unit Bldg-Unit
- 2506 Riverside Dr
- 2536 Riverside Dr
- 2544 Riverside Dr
- 2522 W Jefferson Ave Unit 2534
- 2514 W Jefferson Ave
- 2569 W Jefferson Ave
- 2569 W Jefferson Ave
- 2508 W Jefferson Ave
- 2560 Riverside Dr
- 2500 W Jefferson Ave
- 2470 Riverside Dr
- 2471 W Jefferson Ave
- 2576 Riverside Dr
- 2455 W Jefferson Ave
- 222 Cherry St