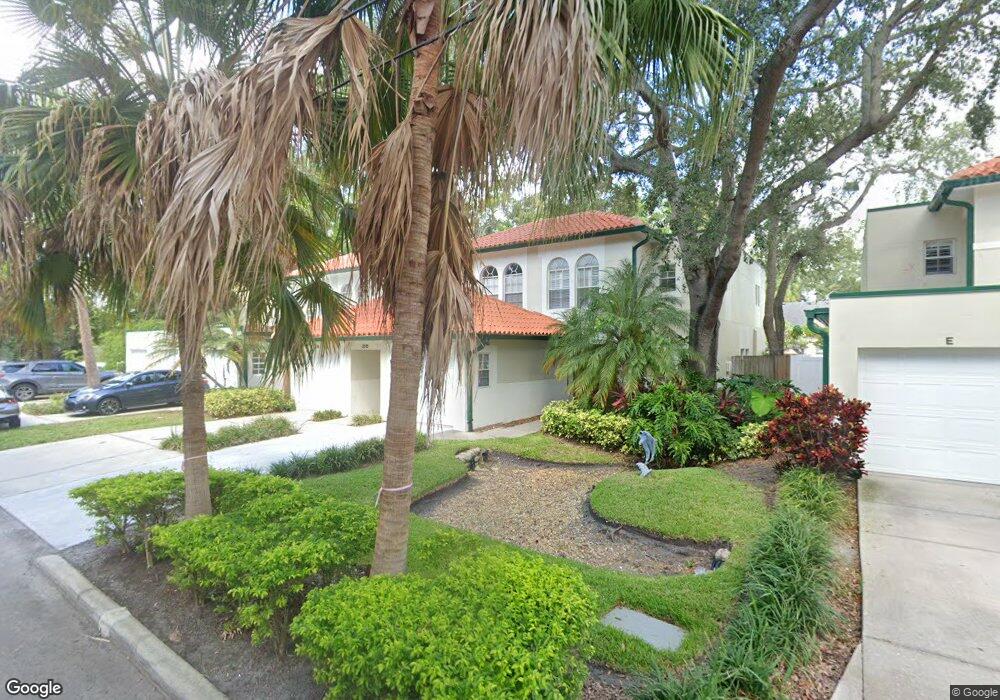
2515 W Kansas Ave Unit B Tampa, FL 33629
Bayshore Beautiful NeighborhoodEstimated Value: $523,000 - $643,000
3
Beds
3
Baths
1,992
Sq Ft
$287/Sq Ft
Est. Value
About This Home
This home is located at 2515 W Kansas Ave Unit B, Tampa, FL 33629 and is currently estimated at $570,797, approximately $286 per square foot. 2515 W Kansas Ave Unit B is a home located in Hillsborough County with nearby schools including Mitchell Elementary School, Wilson Middle School, and Plant High School.
Ownership History
Date
Name
Owned For
Owner Type
Purchase Details
Closed on
Nov 19, 2010
Sold by
Butterfield Andrew
Bought by
Kimball Lance M
Current Estimated Value
Purchase Details
Closed on
Nov 29, 2006
Sold by
Butterfield Andrew and Butterfield Susan
Bought by
Butterfield Andrew
Purchase Details
Closed on
Oct 20, 2005
Sold by
Gould Diane and Gould Richard T
Bought by
Butterfield Andrew A and Butterfield Susan
Home Financials for this Owner
Home Financials are based on the most recent Mortgage that was taken out on this home.
Original Mortgage
$304,950
Interest Rate
5.71%
Mortgage Type
Fannie Mae Freddie Mac
Purchase Details
Closed on
Jul 19, 1999
Sold by
Land In South Tampa Inc
Bought by
Gould Diane
Home Financials for this Owner
Home Financials are based on the most recent Mortgage that was taken out on this home.
Original Mortgage
$141,771
Interest Rate
7.43%
Mortgage Type
New Conventional
Create a Home Valuation Report for This Property
The Home Valuation Report is an in-depth analysis detailing your home's value as well as a comparison with similar homes in the area
Home Values in the Area
Average Home Value in this Area
Purchase History
| Date | Buyer | Sale Price | Title Company |
|---|---|---|---|
| Kimball Lance M | $220,000 | Smith & Associates Title Inc | |
| Butterfield Andrew | -- | None Available | |
| Butterfield Andrew A | $321,000 | Investors Title & Settlement | |
| Gould Diane | $177,300 | -- |
Source: Public Records
Mortgage History
| Date | Status | Borrower | Loan Amount |
|---|---|---|---|
| Previous Owner | Butterfield Andrew A | $304,950 | |
| Previous Owner | Gould Diane | $141,771 |
Source: Public Records
Tax History Compared to Growth
Tax History
| Year | Tax Paid | Tax Assessment Tax Assessment Total Assessment is a certain percentage of the fair market value that is determined by local assessors to be the total taxable value of land and additions on the property. | Land | Improvement |
|---|---|---|---|---|
| 2024 | $3,628 | $227,930 | -- | -- |
| 2023 | $3,528 | $221,291 | $0 | $0 |
| 2022 | $3,426 | $214,846 | $0 | $0 |
| 2021 | $3,377 | $208,588 | $0 | $0 |
| 2020 | $3,340 | $205,708 | $0 | $0 |
| 2019 | $3,273 | $201,083 | $0 | $0 |
| 2018 | $3,244 | $197,334 | $0 | $0 |
| 2017 | $3,192 | $259,629 | $0 | $0 |
| 2016 | $3,095 | $189,300 | $0 | $0 |
| 2015 | $3,100 | $187,984 | $0 | $0 |
| 2014 | -- | $186,492 | $0 | $0 |
| 2013 | -- | $183,736 | $0 | $0 |
Source: Public Records
Map
Nearby Homes
- 2011 S Carolina Ave
- 2515 W Kansas Ave Unit E
- 2314 S Clewis Ct Unit 204
- 2308 S Carolina Ave
- 2315 S Clewis Ct Unit 102
- 2309 S Ardson Place Unit 2
- 2525 W Maryland Ave Unit B
- 2553 W Maryland Ave
- 1513 S Bay Villa Place
- 1508 S Bay Villa Place Unit B
- 2807 W Sitios St
- 2405 S Ardson Place Unit 303A
- 2407 S Ardson Place Unit 601
- 2407 S Ardson Place Unit 201A
- 2903 W San Isidro St
- 2403 S Ardson Place Unit 902B
- 2516 W Palm Dr
- 2516 W Palm Dr Unit 2
- 1409 S Moody Ave
- 1409 S Moody Ave Unit 1
- 2515 W Kansas Ave Unit C
- 2515 W Kansas Ave Unit A
- 2515 W Kansas Ave Unit D
- 2513 W Kansas Ave Unit D
- 2513 W Kansas Ave Unit B
- 2513 W Kansas Ave Unit A
- 2513 W Kansas Ave Unit C
- 2513 W Kansas Ave Unit E
- 2513 W Kansas Ave
- 2518 W Kansas Ave Unit A
- 2518 W Kansas Ave Unit B
- 2512 W Texas Ave
- 2512 W Texas Ave Unit B
- 2512 W Texas Ave Unit C
- 2520 W Kansas Ave Unit B
- 2520 W Kansas Ave Unit A
- 2514 W Kansas Ave Unit B
- 2514 W Kansas Ave Unit C
- 2514 W Kansas Ave Unit 1
- 2514 W Kansas Ave Unit A