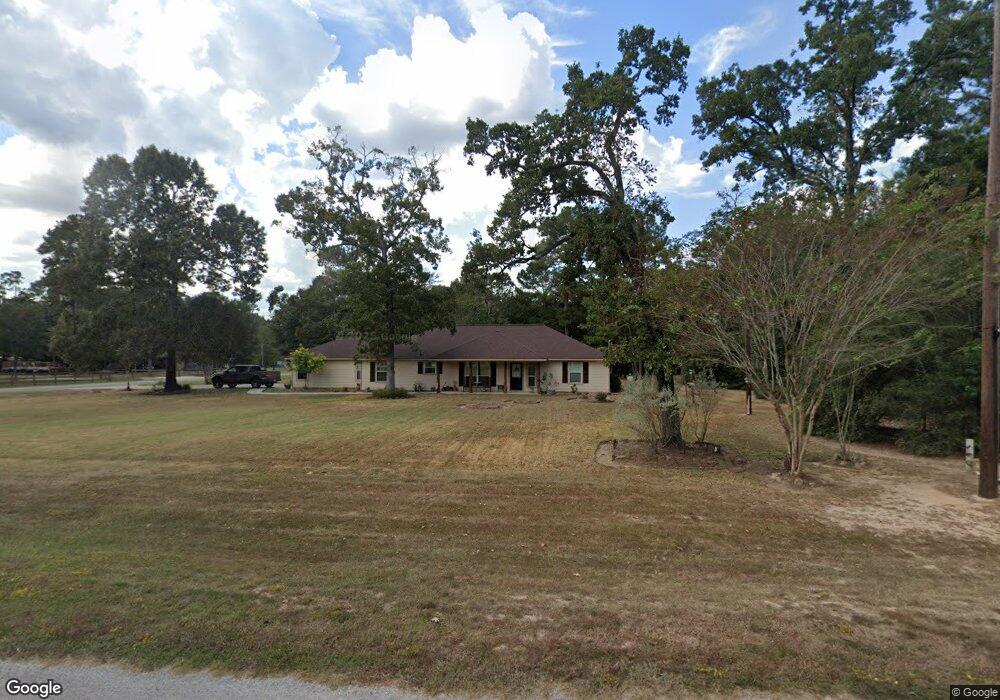
25151 Amanda Ln Hockley, TX 77447
Estimated Value: $350,742 - $434,000
--
Bed
--
Bath
2,008
Sq Ft
$205/Sq Ft
Est. Value
About This Home
This home is located at 25151 Amanda Ln, Hockley, TX 77447 and is currently estimated at $411,436, approximately $204 per square foot. 25151 Amanda Ln is a home located in Waller County with nearby schools including Fields Store Elementary School, Schultz Junior High School, and Waller High School.
Ownership History
Date
Name
Owned For
Owner Type
Purchase Details
Closed on
Jul 18, 2011
Sold by
Stanley Development Company
Bought by
Masden John and Masden Sandy
Current Estimated Value
Home Financials for this Owner
Home Financials are based on the most recent Mortgage that was taken out on this home.
Original Mortgage
$17,000
Outstanding Balance
$11,707
Interest Rate
4.53%
Estimated Equity
$399,729
Purchase Details
Closed on
Dec 11, 2009
Sold by
Scc Realty Company Ltd and Gilley David L
Bought by
Masden John and Masden Sandy
Home Financials for this Owner
Home Financials are based on the most recent Mortgage that was taken out on this home.
Original Mortgage
$125,000
Interest Rate
5.06%
Purchase Details
Closed on
Sep 10, 2009
Sold by
Stanley Development Company
Bought by
Scc Realty Company Ltd
Create a Home Valuation Report for This Property
The Home Valuation Report is an in-depth analysis detailing your home's value as well as a comparison with similar homes in the area
Home Values in the Area
Average Home Value in this Area
Purchase History
| Date | Buyer | Sale Price | Title Company |
|---|---|---|---|
| Masden John | -- | None Available | |
| Masden John | -- | None Available | |
| Scc Realty Company Ltd | -- | None Available |
Source: Public Records
Mortgage History
| Date | Status | Borrower | Loan Amount |
|---|---|---|---|
| Open | Masden John | $17,000 | |
| Previous Owner | Masden John | $125,000 |
Source: Public Records
Tax History Compared to Growth
Tax History
| Year | Tax Paid | Tax Assessment Tax Assessment Total Assessment is a certain percentage of the fair market value that is determined by local assessors to be the total taxable value of land and additions on the property. | Land | Improvement |
|---|---|---|---|---|
| 2025 | $3,885 | $347,690 | $60,500 | $287,190 |
| 2024 | $3,885 | $351,000 | $60,500 | $290,500 |
| 2023 | $3,885 | $326,660 | $60,500 | $266,160 |
| 2022 | $3,588 | $298,230 | $49,940 | $248,290 |
| 2021 | $5,658 | $271,600 | $42,630 | $228,970 |
| 2020 | $4,774 | $223,880 | $42,630 | $181,250 |
| 2019 | $5,072 | $227,820 | $34,650 | $193,170 |
| 2018 | $4,114 | $190,750 | $26,680 | $164,070 |
| 2017 | $4,028 | $185,350 | $26,680 | $158,670 |
| 2016 | $3,960 | $182,200 | $25,850 | $156,350 |
| 2015 | $3,690 | $179,670 | $30,250 | $149,420 |
| 2014 | $3,690 | $165,750 | $30,250 | $135,500 |
Source: Public Records
Map
Nearby Homes
- 26077 Forestcrest Ct
- 149 Cedar Ct
- 378 Ridgewood Dr
- 126 Oak Hills Ct
- 16302 Bermuda Field St
- 16206 Rustic Prairie Dr
- 16106 Rustic Prairie Dr
- 17411 Lavender Blossom Ln
- 29030 Bison Haven Dr
- 29026 Bison Haven Dr
- 29022 Bison Haven Dr
- 16222 Rustic Prairie Dr
- 16103 Rustic Prairie Dr
- 16111 Rustic Prairie Dr
- 16114 Rustic Prairie Dr
- 28947 Rustic Robin Ln
- 16218 Rustic Prairie Dr
- 16119 Rustic Prairie Dr
- 16115 Rustic Prairie Dr
- 28943 Ln
- 25155 Amanda Ln
- 26065 Rolling Forest Ln
- 25159 Amanda Ln
- 26071 Rolling Forest Ln
- 25150 Lakefront Ct
- 26059 Rolling Forest Ln
- 26050 Rolling Forest Ln
- 25154 Lakefront Ct
- 26077 Rolling Forest Ln
- 26053 Rolling Forest Ln
- 25162 Lakefront Ct
- 25158 Amanda Ln
- 26081 Rolling Forest Ln
- 26047 Rolling Forest Ln
- 25165 Amanda Ln
- 25166 Amanda Ln
- 26085 Rolling Forest Ln
- 26071 Forestcrest Ct
- 25151 Christys Ct
- 26064 Amanda Ln