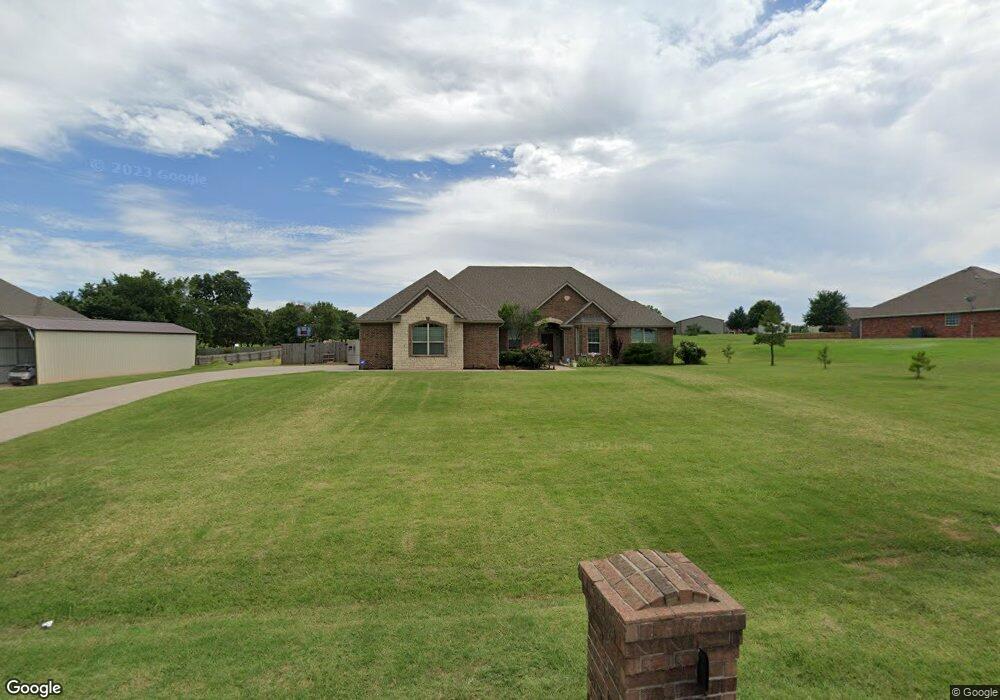
25154 Karly Way Purcell, OK 73080
Estimated Value: $356,000 - $432,000
3
Beds
2
Baths
2,339
Sq Ft
$170/Sq Ft
Est. Value
About This Home
This home is located at 25154 Karly Way, Purcell, OK 73080 and is currently estimated at $397,450, approximately $169 per square foot. 25154 Karly Way is a home with nearby schools including Purcell Elementary School, Purcell Intermediate School, and Purcell Junior High School.
Ownership History
Date
Name
Owned For
Owner Type
Purchase Details
Closed on
Jul 22, 2014
Sold by
Vallerand Tonya L and Vallerand David
Bought by
Dean Jesse
Current Estimated Value
Purchase Details
Closed on
Apr 29, 2010
Sold by
David Dean Construction Inc
Bought by
Vallerand Tonya L and Vallerand David P
Home Financials for this Owner
Home Financials are based on the most recent Mortgage that was taken out on this home.
Original Mortgage
$213,378
Interest Rate
4.91%
Mortgage Type
FHA
Purchase Details
Closed on
Apr 22, 2009
Sold by
Thorntons Landing Llc
Bought by
David Dean Construction Inc
Home Financials for this Owner
Home Financials are based on the most recent Mortgage that was taken out on this home.
Original Mortgage
$177,189
Interest Rate
4.84%
Mortgage Type
Construction
Create a Home Valuation Report for This Property
The Home Valuation Report is an in-depth analysis detailing your home's value as well as a comparison with similar homes in the area
Home Values in the Area
Average Home Value in this Area
Purchase History
| Date | Buyer | Sale Price | Title Company |
|---|---|---|---|
| Dean Jesse | $215,000 | -- | |
| Vallerand Tonya L | $227,500 | Gaco | |
| David Dean Construction Inc | $17,500 | None Available |
Source: Public Records
Mortgage History
| Date | Status | Borrower | Loan Amount |
|---|---|---|---|
| Previous Owner | Vallerand Tonya L | $213,378 | |
| Previous Owner | David Dean Construction Inc | $177,189 |
Source: Public Records
Tax History Compared to Growth
Tax History
| Year | Tax Paid | Tax Assessment Tax Assessment Total Assessment is a certain percentage of the fair market value that is determined by local assessors to be the total taxable value of land and additions on the property. | Land | Improvement |
|---|---|---|---|---|
| 2025 | $3,580 | $32,907 | $3,697 | $29,210 |
| 2024 | $3,405 | $31,340 | $3,521 | $27,819 |
| 2023 | $3,405 | $29,848 | $3,197 | $26,651 |
| 2022 | $3,052 | $28,426 | $2,819 | $25,607 |
| 2021 | $2,943 | $27,073 | $2,342 | $24,731 |
| 2020 | $2,776 | $25,784 | $1,925 | $23,859 |
| 2019 | $2,855 | $26,043 | $1,925 | $24,118 |
| 2018 | $2,858 | $26,303 | $1,925 | $24,378 |
| 2017 | $2,712 | $25,542 | $1,925 | $23,617 |
| 2016 | $2,636 | $24,526 | $1,925 | $22,601 |
| 2015 | $2,582 | $23,650 | $1,925 | $21,725 |
| 2014 | $2,840 | $26,278 | $1,925 | $24,353 |
Source: Public Records
Map
Nearby Homes
- 1930 Deer Trail
- 18304 Johnson Ave
- 18724 Horse Ave
- 19733 Johnson Ave
- 0 Johnson Ave
- 0 Oklahoma 39
- 20196 Holiday Ct
- 20227 Holiday Ct
- 16965 Horse Ave
- 0000 Oklahoma 39
- 1102 Parkview Cir
- 20267 Horse Ave
- 0000 Sooner Ave
- 1216 S Brook Dr
- 1225 Meadow Brook Dr
- 1233 S Brook Dr
- 1212 S Brook Dr
- 1229 Meadow Brook Dr
- 832 W Adams St
- 1007 S Canadian Ave