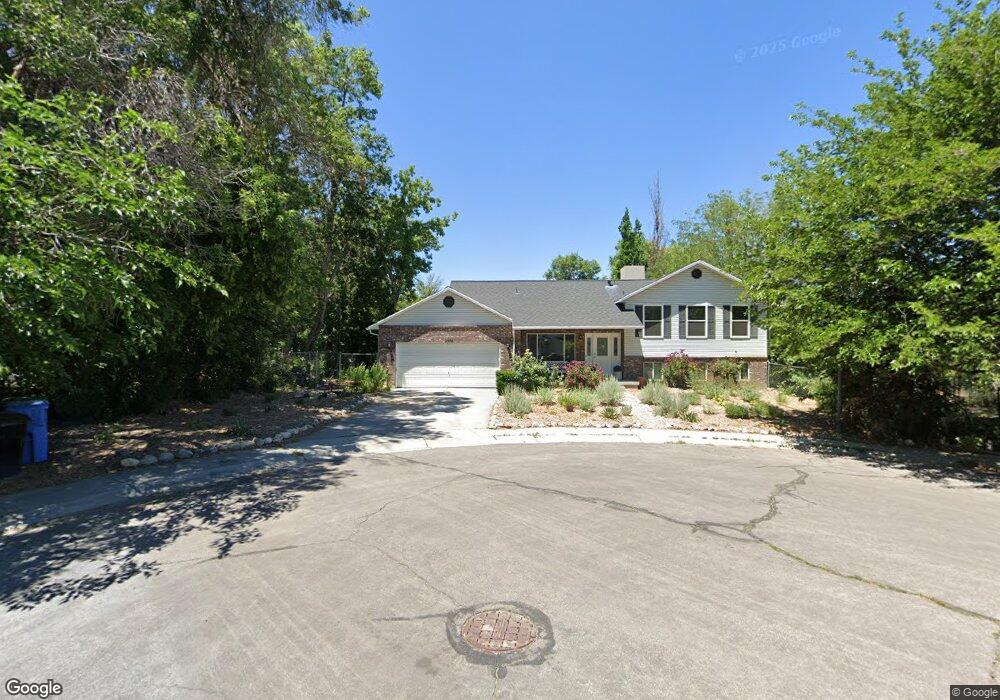
2516 Candy Crest Cir Salt Lake City, UT 84129
Estimated Value: $554,000 - $581,348
4
Beds
2
Baths
1,432
Sq Ft
$395/Sq Ft
Est. Value
About This Home
This home is located at 2516 Candy Crest Cir, Salt Lake City, UT 84129 and is currently estimated at $566,087, approximately $395 per square foot. 2516 Candy Crest Cir is a home located in Salt Lake County with nearby schools including Calvin S Smith Elementary School, Bennion Junior High School, and Taylorsville High School.
Ownership History
Date
Name
Owned For
Owner Type
Purchase Details
Closed on
Aug 31, 2020
Sold by
Hyte Richins Laura and Hyte Richins Laura
Bought by
Mcmullan Roger and Mcmullan Karen
Current Estimated Value
Home Financials for this Owner
Home Financials are based on the most recent Mortgage that was taken out on this home.
Original Mortgage
$307,700
Outstanding Balance
$273,063
Interest Rate
2.9%
Mortgage Type
New Conventional
Estimated Equity
$293,024
Purchase Details
Closed on
Mar 23, 2020
Sold by
Hyte Jane and Trust Number 2516
Bought by
Hyte Rich Laura Jane
Purchase Details
Closed on
Feb 26, 2002
Sold by
Hyte Richins Laura Jane
Bought by
Hute Jane
Purchase Details
Closed on
Sep 28, 2000
Sold by
Larson Laura J
Bought by
Hyle Richins Laura Jane
Purchase Details
Closed on
Jan 2, 1997
Sold by
Varsava Laura Jane and Varsava Michael Steven
Bought by
Larson Laura Jane
Create a Home Valuation Report for This Property
The Home Valuation Report is an in-depth analysis detailing your home's value as well as a comparison with similar homes in the area
Home Values in the Area
Average Home Value in this Area
Purchase History
| Date | Buyer | Sale Price | Title Company |
|---|---|---|---|
| Mcmullan Roger | -- | Stewart Title Ins Agcy Of Ut | |
| Hyte Rich Laura Jane | -- | Stewart Title Ins Agcy Of Ut | |
| Hute Jane | -- | Equity Title | |
| Hyle Richins Laura Jane | -- | -- | |
| Larson Laura Jane | -- | -- |
Source: Public Records
Mortgage History
| Date | Status | Borrower | Loan Amount |
|---|---|---|---|
| Open | Mcmullan Roger | $307,700 |
Source: Public Records
Tax History Compared to Growth
Tax History
| Year | Tax Paid | Tax Assessment Tax Assessment Total Assessment is a certain percentage of the fair market value that is determined by local assessors to be the total taxable value of land and additions on the property. | Land | Improvement |
|---|---|---|---|---|
| 2025 | $3,237 | $560,900 | $167,500 | $393,400 |
| 2024 | $3,237 | $530,800 | $158,700 | $372,100 |
| 2023 | $3,231 | $519,700 | $152,600 | $367,100 |
| 2022 | $3,155 | $511,900 | $149,500 | $362,400 |
| 2021 | $3,622 | $386,400 | $115,000 | $271,400 |
| 2020 | $2,600 | $347,700 | $115,000 | $232,700 |
| 2019 | $2,687 | $339,800 | $108,500 | $231,300 |
| 2018 | $2,992 | $306,400 | $108,500 | $197,900 |
| 2017 | $2,122 | $280,900 | $108,500 | $172,400 |
| 2016 | $2,017 | $253,900 | $108,500 | $145,400 |
| 2015 | $1,944 | $240,300 | $103,900 | $136,400 |
| 2014 | $1,900 | $230,700 | $100,500 | $130,200 |
Source: Public Records
Map
Nearby Homes
- 2503 5520 S
- 1891 S Jordan Canal Rd
- 5668 Lolene Way
- 5574 Easton St
- 5725 S 2665 W
- 2266 W Arches Dr
- 2579 W 5780 S
- 5600 S Ralph Dr
- 2320 W 5400 S
- 5557 S 2200 W
- 5597 S Bastile Dr
- 2794 W Harker Ridge Cove
- 2127 Cedar Breaks Dr
- 2337 Sharron Dr
- 2322 W Surrey Rd
- 2001 W 5540 S
- 5539 S Danube Dr
- 3002 Carranza Dr
- 5552 Hew Wood Dr
- 2104 W Champagne Cir
- 2516 W Candy Crest Cir
- 2516 W Candy Crest Cir
- 2504 Candy Crest Cir
- 2513 W Marsha Brook Cir
- 2513 Marsha Brook Cir
- 2503 Marsha Brook Cir
- 5525 Jordan Canal Rd
- 2484 Candy Crest Cir
- 2484 W Candy Crest Cir
- 2536 W Blake Dr
- 2536 Blake Dr
- 2484 W Candy Crest Cir
- 2548 Blake Dr
- 2487 W Marsha Brook Cir
- 2487 Marsha Brook Cir
- 2493 Candy Crest Cir
- 2522 Blake Dr
- 2570 W Blake Dr
- 2570 Blake Dr
- 2512 Marsha Brook Cir