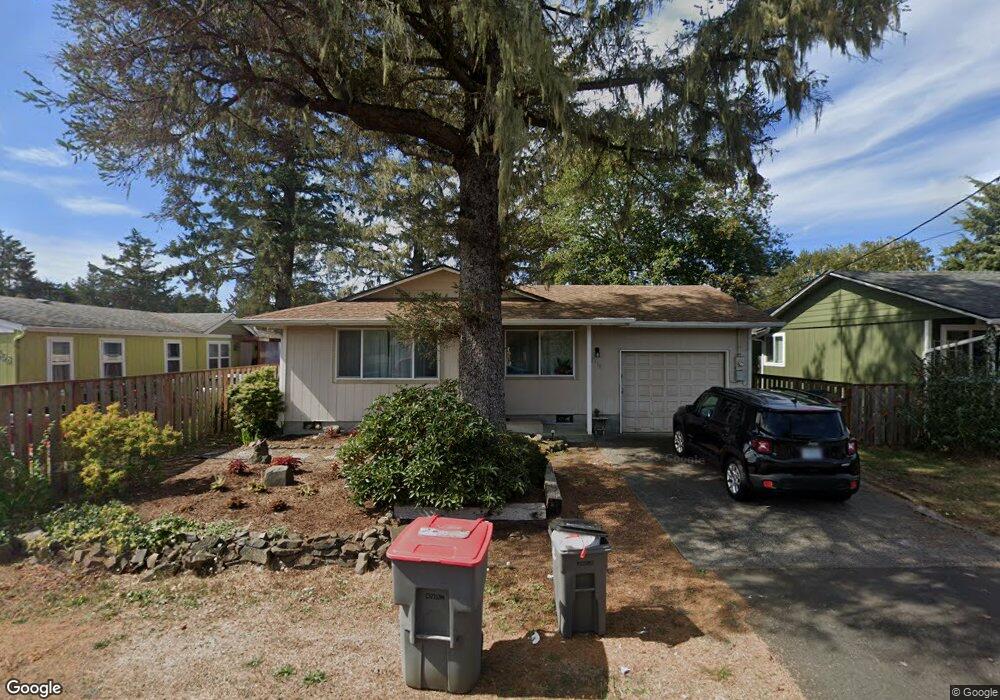
2516 Pine St Seaside, OR 97138
Estimated Value: $363,152 - $412,000
3
Beds
1
Bath
1,024
Sq Ft
$378/Sq Ft
Est. Value
About This Home
This home is located at 2516 Pine St, Seaside, OR 97138 and is currently estimated at $387,538, approximately $378 per square foot. 2516 Pine St is a home located in Clatsop County with nearby schools including Seaside High School.
Ownership History
Date
Name
Owned For
Owner Type
Purchase Details
Closed on
May 28, 2025
Sold by
Fisher Randy J and Matthews-Fisher Naomi D
Bought by
Randy J Fisher Family Rev Living Trust and Fisher
Current Estimated Value
Purchase Details
Closed on
Apr 24, 2008
Sold by
Matthews Barry D and Matthews Akie E
Bought by
Fisher Randy J and Matthews Fisher Naomi D
Home Financials for this Owner
Home Financials are based on the most recent Mortgage that was taken out on this home.
Original Mortgage
$172,000
Interest Rate
6.11%
Mortgage Type
Purchase Money Mortgage
Create a Home Valuation Report for This Property
The Home Valuation Report is an in-depth analysis detailing your home's value as well as a comparison with similar homes in the area
Purchase History
| Date | Buyer | Sale Price | Title Company |
|---|---|---|---|
| Randy J Fisher Family Rev Living Trust | -- | None Listed On Document | |
| Fisher Randy J | $215,000 | Fidelity |
Source: Public Records
Mortgage History
| Date | Status | Borrower | Loan Amount |
|---|---|---|---|
| Previous Owner | Fisher Randy J | $172,000 |
Source: Public Records
Tax History
| Year | Tax Paid | Tax Assessment Tax Assessment Total Assessment is a certain percentage of the fair market value that is determined by local assessors to be the total taxable value of land and additions on the property. | Land | Improvement |
|---|---|---|---|---|
| 2025 | $2,436 | $169,529 | -- | -- |
| 2024 | $2,364 | $164,592 | -- | -- |
| 2023 | $2,295 | $159,799 | $0 | $0 |
| 2022 | $2,232 | $155,146 | $0 | $0 |
| 2021 | $2,185 | $150,628 | $0 | $0 |
| 2020 | $2,134 | $146,241 | $0 | $0 |
| 2019 | $2,075 | $141,982 | $0 | $0 |
| 2018 | $1,993 | $137,847 | $0 | $0 |
| 2017 | $1,902 | $133,833 | $0 | $0 |
| 2016 | $1,673 | $129,936 | $46,859 | $83,077 |
| 2015 | $1,610 | $126,153 | $45,495 | $80,658 |
| 2014 | $1,625 | $122,479 | $0 | $0 |
| 2013 | -- | $118,913 | $0 | $0 |
Source: Public Records
Map
Nearby Homes
- 802 25th Ave
- 2440 Pine St
- 2674 U S 101
- 0 Cross Creek St Unit 12
- 0 Cross Creek St Unit 10
- 0 Cross Creek St Unit 11
- 0 Cross Creek St Unit 26-112
- 0 Cross Creek St Unit 13
- 0 Cross Creek St Unit 26-114
- 0 Cross Creek St Unit 26-115
- 0 Cross Creek St Unit 26-116
- 0 Cross Creek St Unit 14
- 0 Cross Creek St Unit 26-117
- 2657 N Hwy 101 Unit 6
- 2550 Boehm Acres Rd
- 782 Woodland Ct
- 934 H St
- 790 17th Ave
- 1265 D St
- 1350 13th Ave
Your Personal Tour Guide
Ask me questions while you tour the home.