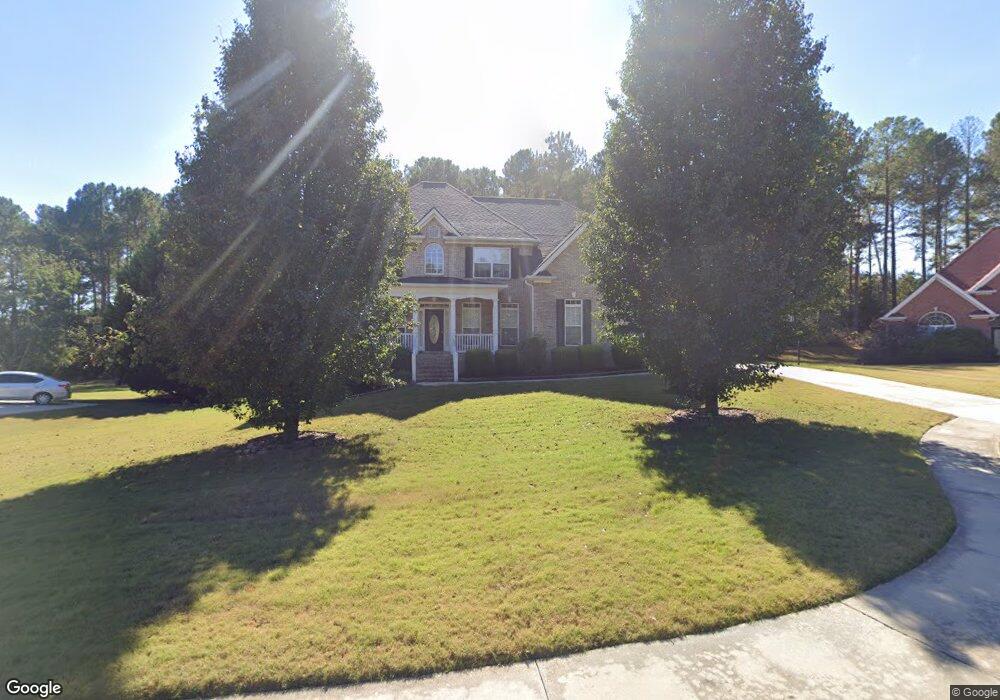
2516 Sagemore Ct Unit 2 Conyers, GA 30094
Estimated Value: $458,000 - $541,000
4
Beds
3
Baths
2,824
Sq Ft
$171/Sq Ft
Est. Value
About This Home
This home is located at 2516 Sagemore Ct Unit 2, Conyers, GA 30094 and is currently estimated at $481,942, approximately $170 per square foot. 2516 Sagemore Ct Unit 2 is a home located in Rockdale County with nearby schools including Sims Elementary School, Edwards Middle School, and Heritage High School.
Ownership History
Date
Name
Owned For
Owner Type
Purchase Details
Closed on
Aug 21, 2024
Sold by
Griffin Anitra
Bought by
Griffin Anitra and Griffin Assata A
Current Estimated Value
Home Financials for this Owner
Home Financials are based on the most recent Mortgage that was taken out on this home.
Original Mortgage
$374,440
Interest Rate
6.78%
Mortgage Type
New Conventional
Purchase Details
Closed on
Aug 19, 2024
Sold by
Griffin Eddie
Bought by
Griffin Anitra
Home Financials for this Owner
Home Financials are based on the most recent Mortgage that was taken out on this home.
Original Mortgage
$374,440
Interest Rate
6.78%
Mortgage Type
New Conventional
Purchase Details
Closed on
May 7, 2004
Sold by
Thompson Bldrs Inc
Bought by
Griffin Eddie and Griffin Anitra
Home Financials for this Owner
Home Financials are based on the most recent Mortgage that was taken out on this home.
Original Mortgage
$57,325
Interest Rate
5.77%
Mortgage Type
New Conventional
Create a Home Valuation Report for This Property
The Home Valuation Report is an in-depth analysis detailing your home's value as well as a comparison with similar homes in the area
Home Values in the Area
Average Home Value in this Area
Purchase History
| Date | Buyer | Sale Price | Title Company |
|---|---|---|---|
| Griffin Anitra | -- | -- | |
| Griffin Anitra | -- | -- | |
| Griffin Eddie | $286,700 | -- |
Source: Public Records
Mortgage History
| Date | Status | Borrower | Loan Amount |
|---|---|---|---|
| Previous Owner | Griffin Anitra | $374,440 | |
| Previous Owner | Griffin Eddie | $57,325 | |
| Previous Owner | Griffin Eddie | $229,300 |
Source: Public Records
Tax History
| Year | Tax Paid | Tax Assessment Tax Assessment Total Assessment is a certain percentage of the fair market value that is determined by local assessors to be the total taxable value of land and additions on the property. | Land | Improvement |
|---|---|---|---|---|
| 2025 | $5,724 | $215,080 | $38,040 | $177,040 |
| 2024 | $5,258 | $206,720 | $34,280 | $172,440 |
| 2023 | $3,587 | $148,400 | $34,280 | $114,120 |
| 2022 | $3,392 | $140,800 | $34,280 | $106,520 |
| 2021 | $3,136 | $122,720 | $31,200 | $91,520 |
| 2020 | $2,939 | $111,360 | $28,160 | $83,200 |
| 2019 | $2,654 | $99,720 | $16,520 | $83,200 |
| 2018 | $2,471 | $93,280 | $13,920 | $79,360 |
| 2017 | $2,326 | $87,600 | $13,920 | $73,680 |
| 2016 | $2,150 | $87,600 | $13,920 | $73,680 |
| 2015 | $2,154 | $87,600 | $13,920 | $73,680 |
| 2014 | $1,927 | $87,600 | $13,920 | $73,680 |
| 2013 | -- | $99,000 | $26,000 | $73,000 |
Source: Public Records
Map
Nearby Homes
- 1604 Golden Creek Courts SW
- 1600 Golden Creek Courts SW
- 333 Yukon Dr Unit 62
- 415 Sunflower St
- 407 Whitehorse Way Unit 39
- 331 Yukon Dr Unit 63
- 1309 Marseille Ct SW
- 1920 Heritage Place SW
- 2628 High St SW Unit 2
- 1918 Heritage Dr SW Unit 3
- 2630 Hwy 138
- 2329 Lochinver Ln SW
- 2601 High St SW
- 2315 Lochinver Ln SW
- 5011 SE West Lake Dr
- 3284 Creekside Dr SE
- 2742 Pitlochry St SW Unit 3
- 2522 Chimney Ridge Dr SW
- 2718 Pitlochry St SW Unit 2
- 3009 Inverness Ct
- 2512 Sagemore Ct Unit 18
- 2512 Sagemore Ct
- 2513 Sagemore Ct Unit 2
- 2325 New Haven Place Unit 2
- 2508 Sagemore Ct
- 2331 New Haven Place
- 2521 Sagemore Ct Unit 2
- 2335 New Haven Place
- 2347 New Haven Place Unit 3
- 2517 Sagemore Ct
- 2509 Sagemore Ct
- 2351 New Haven Place
- 2321 New Haven Place
- 2339 New Haven Place
- 2504 Sagemore Ct Unit 2
- 2317 New Haven Place
- 2505 Sagemore Ct
- 2404 Mercer Walk
- 2355 New Haven Place
- 2309 New Haven Place
Your Personal Tour Guide
Ask me questions while you tour the home.