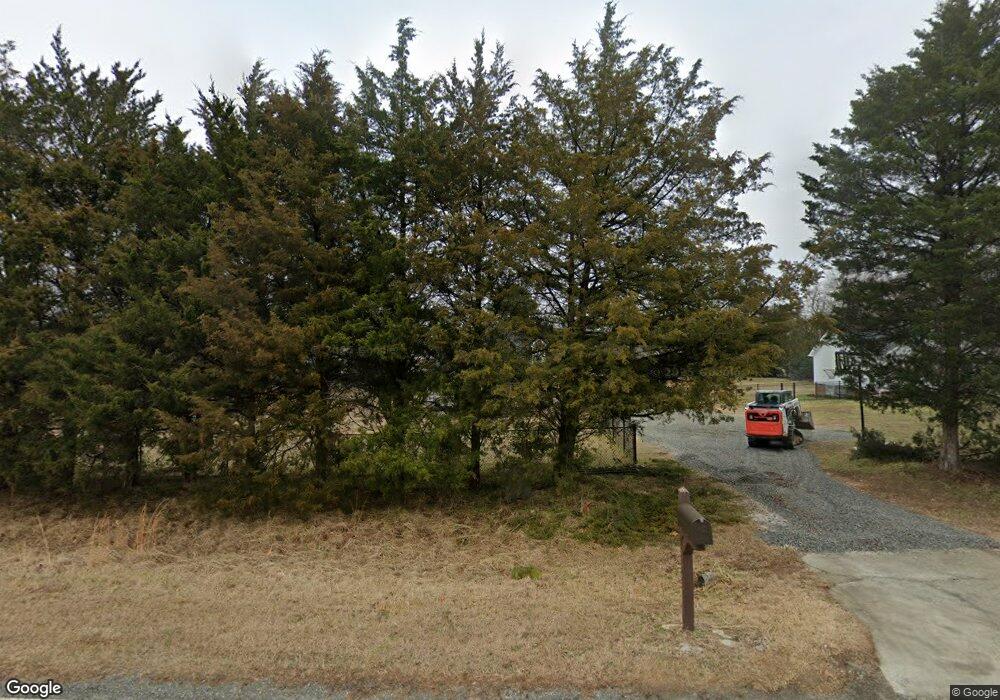
2516 Wes Sandling Rd Unit Lot13 Franklinton, NC 27525
Estimated Value: $310,000 - $349,594
3
Beds
3
Baths
1,458
Sq Ft
$226/Sq Ft
Est. Value
About This Home
This home is located at 2516 Wes Sandling Rd Unit Lot13, Franklinton, NC 27525 and is currently estimated at $329,399, approximately $225 per square foot. 2516 Wes Sandling Rd Unit Lot13 is a home located in Granville County with nearby schools including Tar River Elementary School, G.C. Hawley Middle School, and South Granville High School.
Ownership History
Date
Name
Owned For
Owner Type
Purchase Details
Closed on
Jun 15, 2017
Sold by
Tony Rollinson
Bought by
Pulley Jon Ta and Pulley Jeanne
Current Estimated Value
Home Financials for this Owner
Home Financials are based on the most recent Mortgage that was taken out on this home.
Original Mortgage
$181,818
Outstanding Balance
$150,777
Interest Rate
3.91%
Estimated Equity
$178,622
Purchase Details
Closed on
May 8, 2013
Sold by
Hebert Mare L and Hebert Nicole M
Bought by
Rollinson Tony and Rollinson Karen
Home Financials for this Owner
Home Financials are based on the most recent Mortgage that was taken out on this home.
Original Mortgage
$132,142
Interest Rate
3.59%
Mortgage Type
New Conventional
Create a Home Valuation Report for This Property
The Home Valuation Report is an in-depth analysis detailing your home's value as well as a comparison with similar homes in the area
Home Values in the Area
Average Home Value in this Area
Purchase History
| Date | Buyer | Sale Price | Title Company |
|---|---|---|---|
| Pulley Jon Ta | -- | -- | |
| Rollinson Tony | $130,000 | None Available |
Source: Public Records
Mortgage History
| Date | Status | Borrower | Loan Amount |
|---|---|---|---|
| Open | Pulley Jon Ta | $181,818 | |
| Closed | Pulley Jon Ta | -- | |
| Previous Owner | Rollinson Tony | $132,142 |
Source: Public Records
Tax History Compared to Growth
Tax History
| Year | Tax Paid | Tax Assessment Tax Assessment Total Assessment is a certain percentage of the fair market value that is determined by local assessors to be the total taxable value of land and additions on the property. | Land | Improvement |
|---|---|---|---|---|
| 2025 | $1,767 | $240,616 | $37,000 | $203,616 |
| 2024 | $1,767 | $240,616 | $37,000 | $203,616 |
| 2023 | $1,762 | $157,679 | $27,500 | $130,179 |
| 2022 | $1,516 | $157,679 | $27,500 | $130,179 |
| 2021 | $1,417 | $157,679 | $27,500 | $130,179 |
| 2020 | $1,417 | $157,679 | $27,500 | $130,179 |
| 2019 | $1,417 | $157,679 | $27,500 | $130,179 |
| 2018 | $1,417 | $157,679 | $27,500 | $130,179 |
| 2016 | $1,356 | $143,604 | $27,500 | $116,104 |
| 2015 | $1,279 | $143,604 | $27,500 | $116,104 |
| 2014 | $1,279 | $143,604 | $27,500 | $116,104 |
| 2013 | -- | $143,604 | $27,500 | $116,104 |
Source: Public Records
Map
Nearby Homes
- 4570 John Sandling Rd
- 60 Hardwood Dr
- 55 Hardwood Dr
- 190 Hardwood Dr
- 30 Grist Mill Dr
- 00 Stonehouse Ct
- 70 Grist Mill Dr
- 25 Daisy Dr
- 140 Cordoba Dr
- 150 Cordoba Dr
- 145 Cordoba Dr
- 25 Cordoba Dr
- 100 Cordoba Dr
- 125 Cordoba Dr
- 135 Cordoba Dr
- 15 Cordoba Dr
- 130 Cordoba Dr
- 2074 W Green St
- 2493 Golden Forest Dr
- 2718 Flat Rock Rd
- 2516 Wes Sandling Rd
- 2514 Wes Sandling Rd
- 10 Hardwood Dr
- 14 Hardwood Dr
- 18 Hardwood Dr
- 2512 Wes Sandling Rd
- 4561 John Sandling Rd
- 20 Hardwood Dr
- 26 Hardwood Dr
- 2512 Grove Hill Rd
- 4565 John Sandling Rd
- 954 Wes Sandling Rd
- 17 Hardwood Dr
- 2522 Grove Hill Rd
- 15 Hardwood Dr
- 19 Hardwood Dr
- 30 Hardwood Dr
- 971 Wes Sandling Rd
- 32 Hardwood Dr
- 21 Hardwood Dr